
Paul Maric
1200hp Ram TRX vs Lamborghini Revuelto drag race
4 Days Ago
Hybrid and fully electric vehicles have overcome an otherwise unchanged used vehicle market with growing sales last month.

Contributor

Contributor
Stagnant sales of used petrol and diesel cars in Australia couldn’t stop hybrids and electric vehicles (EVs) stealing the limelight during April, with significant growth across the board for electrified models on the second-hand market.
Last month, 183,575 used cars were sold across Australia, according to data compiled by AutoGrab and published by the Australian Automotive Dealer Association (AADA).
This represented a drop of just 0.3 per cent on the month prior, largely attributed to decreases of 4.3 and 0.2 per cent in New South Wales and Victoria respectively.
The average time for a car to sell rose by just 0.1 of a day to 44.3 days, remaining well below the market high reached late last year.
While petrol and diesel continues to dominate the new and used car markets, there was a 0.8 per cent reduction in petrol vehicle sales throughout April (reaching 116,985 examples), with diesels growing by just 0.1 per cent or 49 deliveries (to 57,953 total).
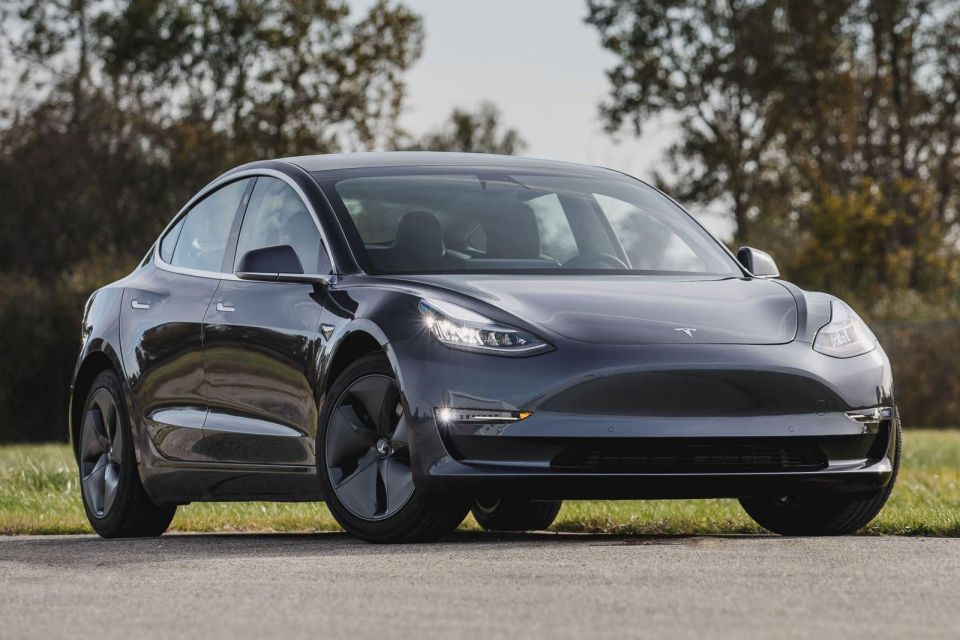
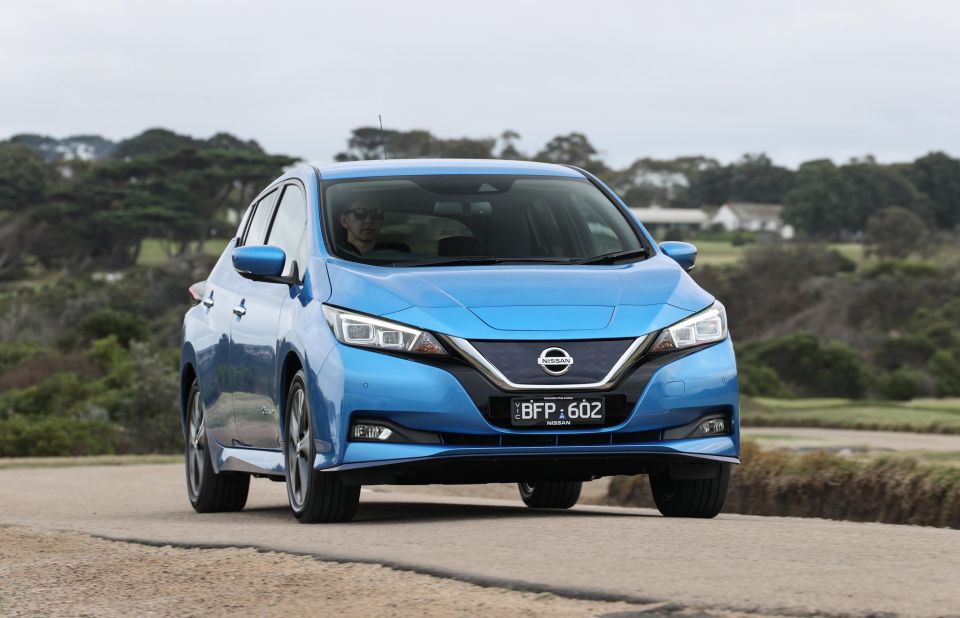
However, hybrids remained in third place with growth of 5.7 per cent to 6725 sales, followed by EVs which increased by 9.5 per cent to 1525 vehicles sold – continuing on from a strong March which saw a 13.5 per cent rise.
Despite plug-in hybrids also experiencing an increase in sales, they still sit behind those powered by LPG in the used vehicle ranks, with both drivetrains proving to be niche interests within the wider market.
“There is still a significant oversupply of EVs relative to other fuel types, but the mismatch between demand and supply seems to be reducing with EV sales growing at the same time as EV listings decline,” AADA CEO James Voortman said.
“The average time to sell a used car has remained around the 44-day mark for the past three months, significantly down from the 12-month high of 52 days in November, indicating the market is stabilising.”
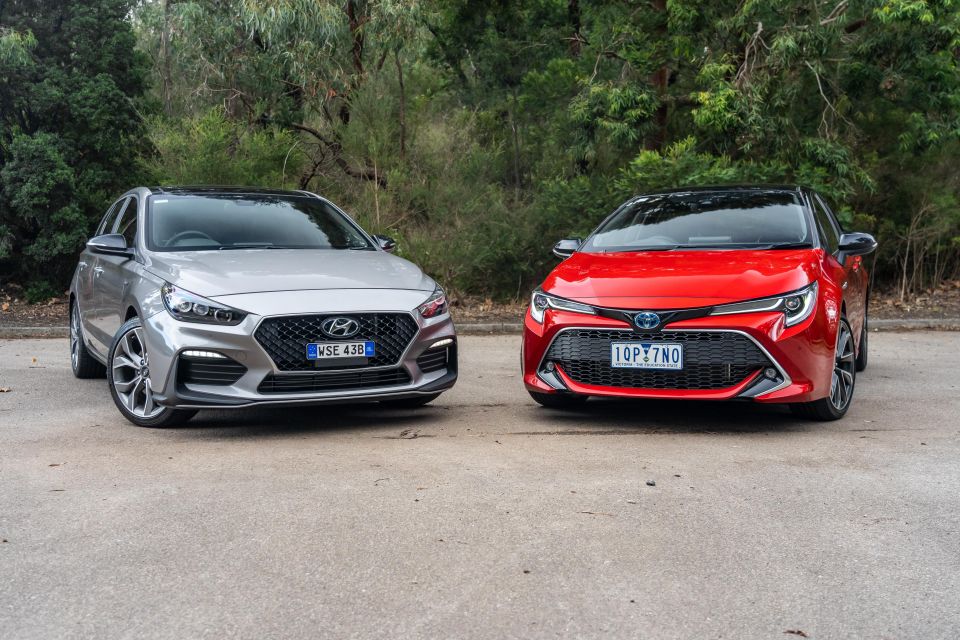
In terms of what kinds of used cars Australians are buying, traditional passenger vehicles such as hatchbacks, sedans and wagons still command the biggest share of the market (75,140 sales in April, down 1.3 per cent), but with an ever-decreasing margin to SUVs (70,861 sales, up 1.0 per cent).
Utes continue to be the third-largest sellers, reflected by the fact that the Ford Ranger and Toyota HiLux are the two most popular vehicles among used buyers, with the Mitsubishi Triton also placing itself in the top 10.
Surprisingly, there are just two SUVs within the first 10 spots (the Toyota RAV4 and Mazda CX-5), while the remaining five vehicles are of the traditional passenger kind.
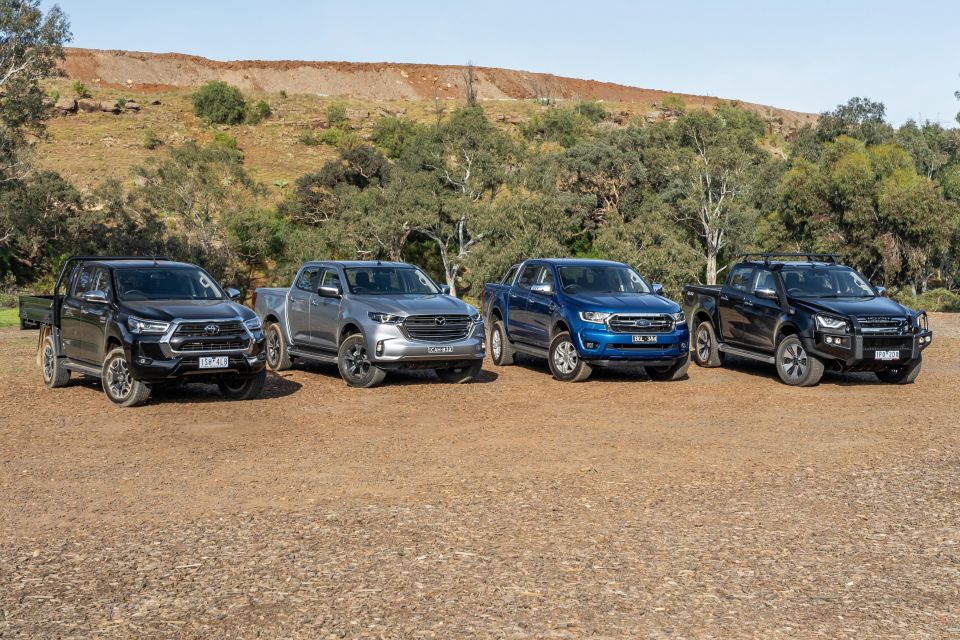
The data also shows the Toyota Yaris, Kia Picanto and Honda Civic are among the best three mainstream passenger vehicles in terms of retained value, though the Suzuki Jimny continues to dominate the overall market, with the Toyota LandCruiser a solid second among SUVs.
“Retained values continue to decline gradually across all segments with passenger vehicles holding up slightly better than SUVs and LCVs,” Mr Voortman added.
“Given the fact that the gap between used car supply and demand is reducing, it will be interesting to see what the effect will be on retained values and length of time to sell.”
The report’s figures are based on data about the number of used and dealer demonstrator cars listed for sale around Australia at the start of the month, which are compared with the number of those listings that have been taken down at the end.
The AADA and AutoGrab offer the following definitions:
Best-selling used cars
| Model | Sales (April 2024) | Change from March | Average days to sell |
|---|---|---|---|
| Ford Ranger | 5557 | +7.4% | 47.4 |
| Toyota HiLux | 4348 | +1.9% | 43.9 |
| Toyota Corolla | 3741 | +0.8% | 31.2 |
| Toyota Camry | 2659 | +1.4% | 37.2 |
| Mitsubishi Triton | 2534 | -0.4% | 42 |
| Hyundai i30 | 2439 | +1.2% | 30.5 |
| Toyota RAV4 | 2337 | +10.2% | 39 |
| Mazda 3 | 2317 | +1.8% | 34 |
| Mazda CX-5 | 2206 | +5.8% | 39.5 |
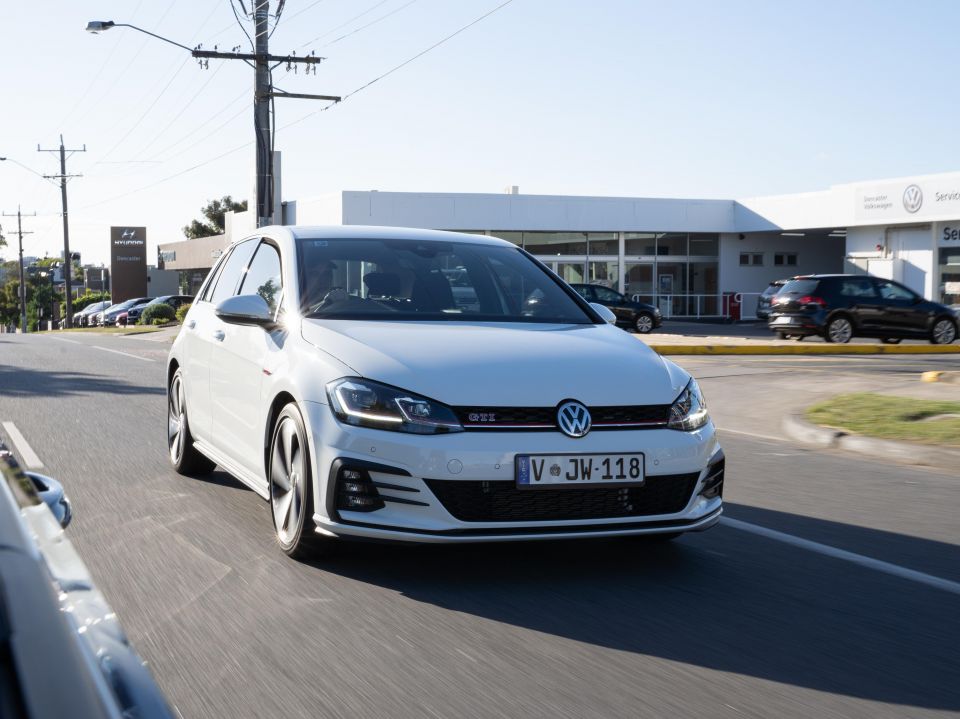
| Volkswagen Golf | 2177 | +12.4% | 42.8 |
Used car sales by state and territory
| State/territory | Vehicles listed | Vehicles sold |
|---|---|---|
| New South Wales | 81,667 | -2.9% |
| Victoria | 75,958 | -3.6% |
| Queensland | 58,405 | -4.4% |
| Western Australia | 29,659 | -8.2% |
| South Australia | 18,754 | +0.2% |
| Tasmania | 5221 | -3.9% |
| Australian Capital Territory | 5036 | +0.7% |
| Northern Territory | 2019 | -4.7% |
Sales by vehicle type
| Listed for sale | Total sales | |
|---|---|---|
| Passenger cars | 99,544 | 75,140 |
| SUVs | 112,875 | 70,861 |
| Utes | 54,463 | 32,368 |
| Vans and buses | 9837 | 5,206 |
Sales by fuel type
| Vehicle type | Sales (April 2024) | Change from March |
|---|---|---|
| Petrol | 116,985 | -0.8% |
| Diesel | 57,953 | +0.1% |
| Hybrid | 6725 | +5.7% |
| EV | 1525 | +9.5% |
| LPG | 236 | -11.9% |
| Plug-in hybrid (PHEV) | 151 | +2.7% |
MORE: Used car sales March 2024 – Market up, EVs see big gains MORE: Used car sales drop, but they’re selling more quickly MORE: Used car sales rise in strong start to 2024 MORE: Australia’s best-selling used cars in December 2023 MORE: Australia’s used car sales results for 2023 revealed
Born and raised in Canberra, Jordan has worked as a full-time automotive journalist since 2021, being one of the most-published automotive news writers in Australia before joining CarExpert in 2024.


Paul Maric
4 Days Ago

Max Davies
3 Days Ago

James Wong
3 Days Ago

Shane O'Donoghue
2 Days Ago

Damion Smy
2 Days Ago

Matt Campbell
1 Day Ago