

Damion Smy
Last petrol-powered Jaguar built
60 Minutes Ago
We just saw the steepest drop in May car sales ever, but there are 'green shoots' appearing as dealers report an uptick in interest.

Senior Contributor

Senior Contributor
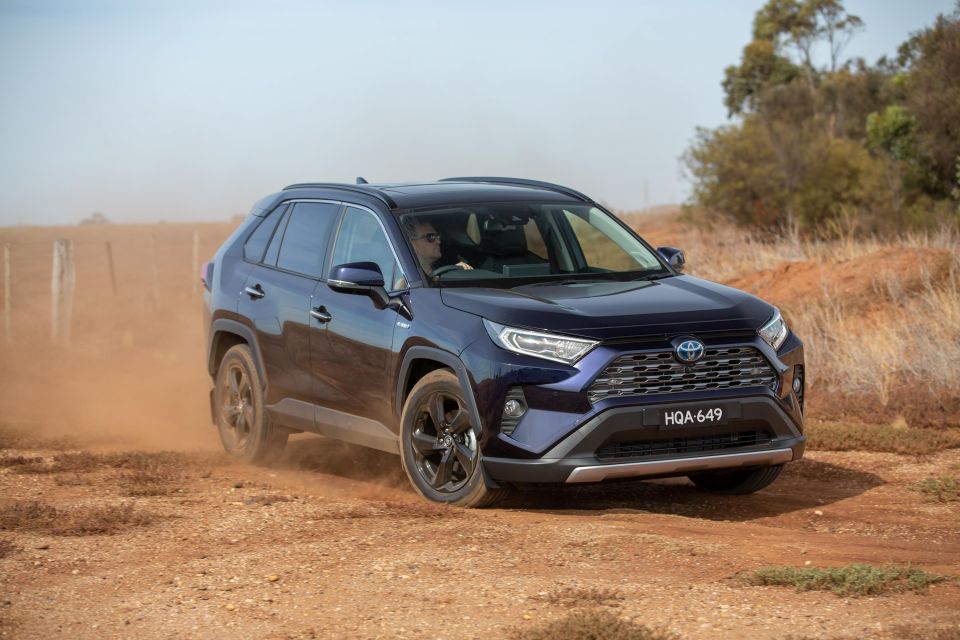
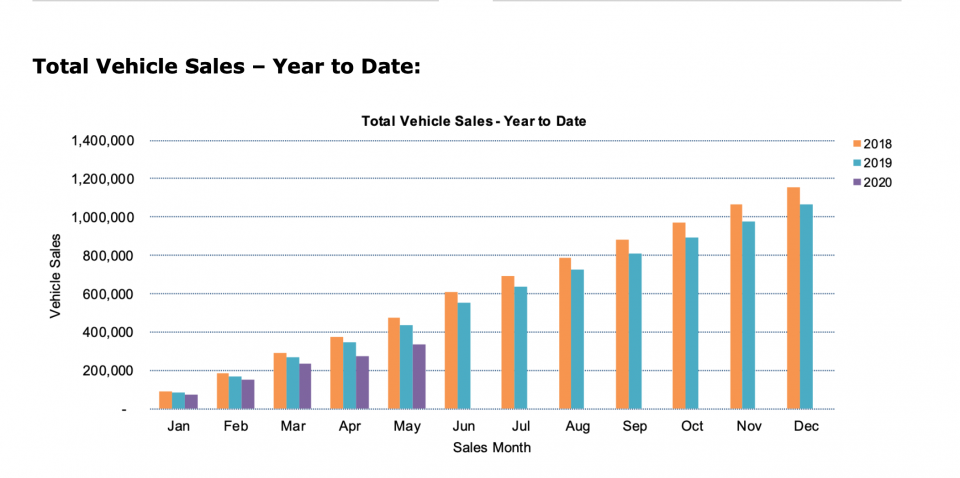
New vehicle sales unsurprisingly tanked in May, tumbling by an unprecedented 35.3 per cent compared to the same month in 2019.
VFACTS data recorded 59,894 sales of cars, SUVs, light commercials and heavy commercials for the month. At the height of the global financial crisis in May 2009, sales were 75,441.
The passenger vehicle market was down by 15,054 sales (-52.1 per cent) compared to the same month last year, SUVs were down by 12,285 sales (-30 per cent), and light-commercial utes and vans were down by 4387 sales (-22.9 per cent).
That being said, the fall wasn’t as drastic as the 48.5 per cent decline that we witnessed in April, when COVID-19 restrictions were at their harshest.
CEO of the Federal Chamber of Automotive Industries (FCAI) – the peak lobby group for the car-makers – Tony Weber said the virus was just the latest in a series of problems to beset the industry.
“May 2020 is the 26th consecutive month of negative growth for the market, and the causative factors are well documented – droughts, floods, bushfires, tight lending conditions, unfavourable exchange rates, and political uncertainty,” he said.
“Now, we add to that the devastating effect of the COVID-19 pandemic over the past three months. While COVID-19 is primarily a health crisis, it has brought about an economic crisis as well… and this of course has repercussions for the local sales sector, including the automotive industry.”
At the same time, Weber welcomed the federal government’s “timely response” with policies such as JobKeeper, and claimed to see “green shoots” in the marketplace.
“With people venturing out a little more, dealers have advised of a slight uptick in floor traffic through dealerships… Additionally, we are hearing from some brands that website traffic is on the rise – a sure sign of increased purchasing interest.
“And finally, brand End of Financial Year campaigns have started, meaning the opportunity to snare a bargain has increased significantly.”
Then again, the representative for car brands would say that, right?

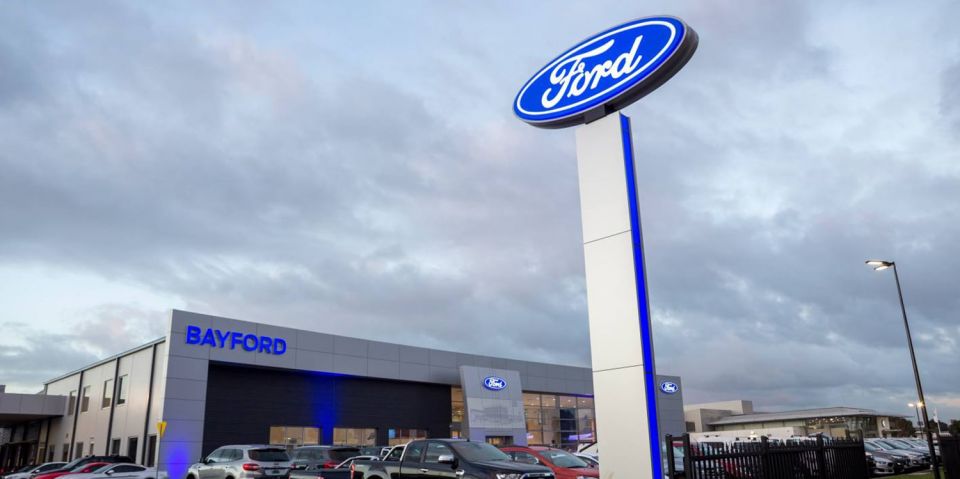
Toyota was utterly dominant, snaring 24.2 per cent total market share. In other words, nearly a quarter of all vehicles sold wore a Toyota badge.
Every mainstream brand of note went backwards at a rate of knots: Mazda in second place declined by 34 per cent, Hyundai by 49 per cent, Ford by 33 per cent, Mitsubishi by 41 per cent, Volkswagen by 38.5 per cent, Kia by 50 per cent (the fast-growing brand’s worst performance in ages), Mercedes-Benz including vans and utes by 28 per cent, Nissan by 44 per cent, and Subaru by 50 per cent.
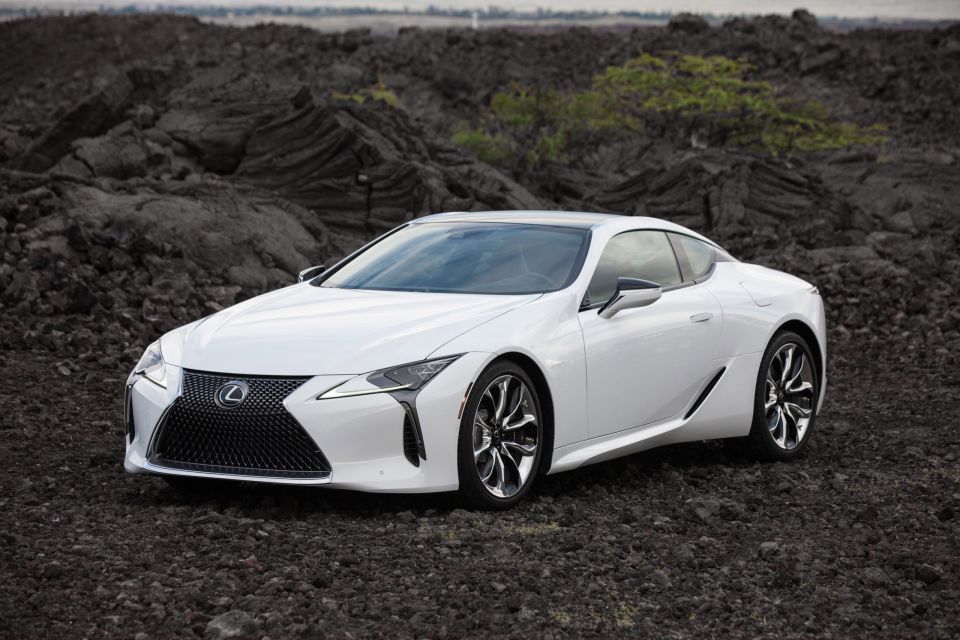
Positions 11-20 were occupied by: BMW (down just 1.9 per cent), Honda (down 47 per cent), Holden (down 61.5 per cent and now almost out of stock), Isuzu Ute (down 32 per cent as it gears up for the brand new D-Max launch this month), Audi (down only 4 per cent), Suzuki (down 38 per cent), MG (up 14.5 per cent, the highest-volume brand that grew), Lexus (down 28 per cent), LDV (down 20.5 per cent), and Land Rover (down 46 per cent).
You can see a full list below. Note that Ferrari’s 20 sales doubled that of Citroen and quadrupled Genesis…
Note also Ram Trucks, distributed by Sydney’s Ateco and re-engineered to right-hand drive by Walkinshaw in Melbourne, grew sales of the 1500 pickup by 42 per cent and got within 8 units of outselling Jeep, which has native right-hand vehicles sold by a factory distributor.
Sales by brand, May 2020 v May 2019
| Brand | Sales | +/- % |
|---|---|---|
| Toyota | 14,466 | -23.1 |
| Mazda | 5661 | -34 |
| Hyundai | 4109 | -49.3 |
| Ford | 3894 | -32.7 |
| Mitsubishi | 3010 | -41.2 |
| Volkswagen | 2781 | -38.5 |
| Kia | 2760 | -50.1 |
| Mercedes-Benz | 2255 | -28.3 |
| Nissan | 2216 | -44.2 |
| Subaru | 2023 | -49.7 |
| BMW | 2013 | -1.9 |
| Honda | 1952 | -47.2 |
| Holden | 1689 | -61.5 |
| Isuzu Ute | 1439 | -32.4 |
| Audi | 1126 | -4.3 |
| Suzuki | 933 | -37.8 |
| MG | 664 | +14.5 |
| Lexus | 620 | -27.9 |
| LDV | 454 | -20.5 |
| Land Rover | 452 | -46.3 |
| Skoda | 402 | -35.5 |
| Volvo Car | 400 | -33.3 |
| Renault | 360 | -37.2 |
| Jeep | 341 | -31.9 |
| Ram | 333 | +42.3 |
| Porsche | 328 | -29.5 |
| Mini | 238 | -10.2 |
| Haval | 207 | +73.9 |
| Great Wall | 120 | -20 |
| Peugeot | 113 | -21.5 |
| Jaguar | 110 | -32.9 |
| Fiat | 81 | -50.9 |
| SsangYong | 76 | N/A |
| Maserati | 29 | -50.8 |
| Alfa Romeo | 28 | -51.7 |
| Ferrari | 20 | -23.1 |
| Bentley | 14 | -12.5 |
| Citroen | 10 | -82.1 |
| McLaren | 7 | -30 |
| Chrysler | 7 | -75.9 |
| Lamborghini | 6 | -53.8 |
| Aston Martin | 6 | -33.3 |
| Lotus | 6 | +500 |
| Genesis | 5 | +66.7 |
| Rolls-Royce | 2 | -33.3 |
| Morgan | 1 | -50 |
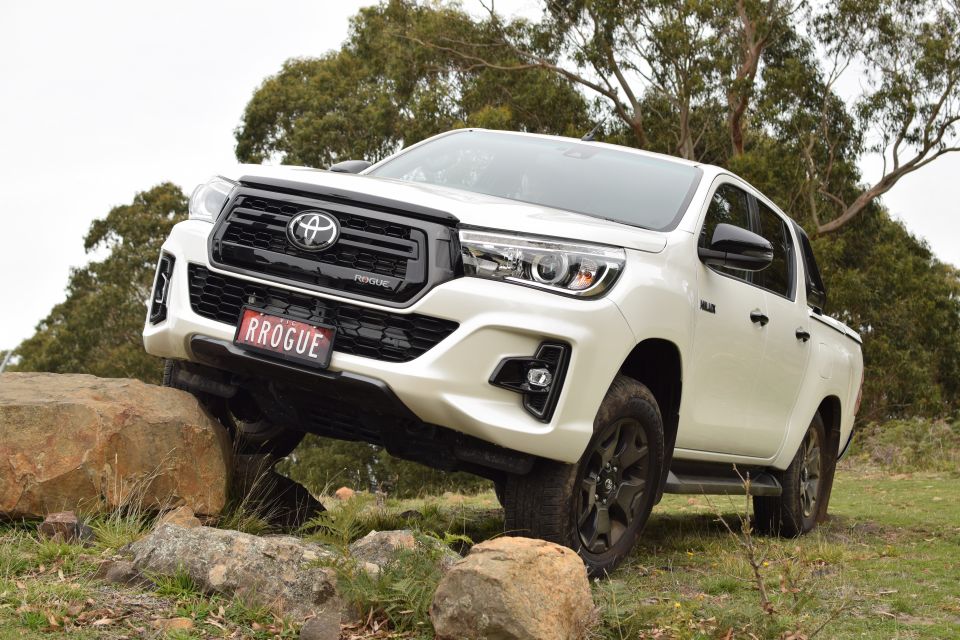
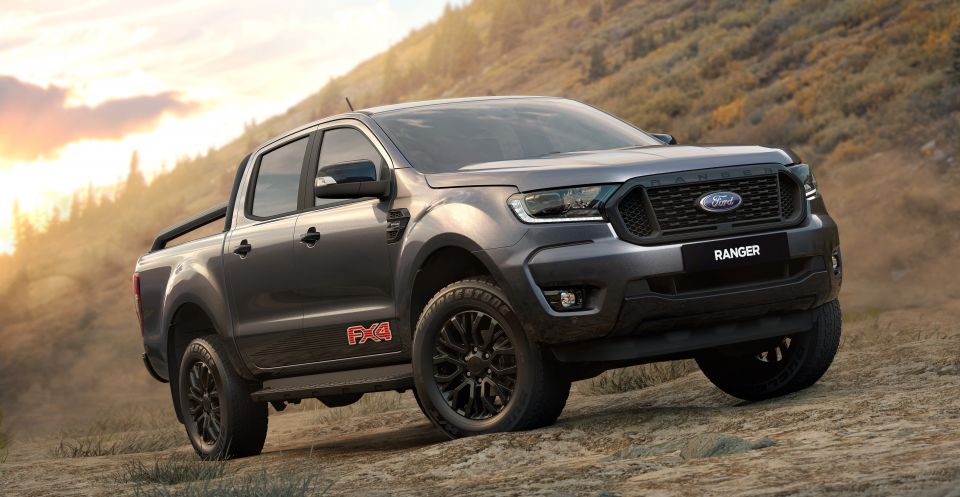
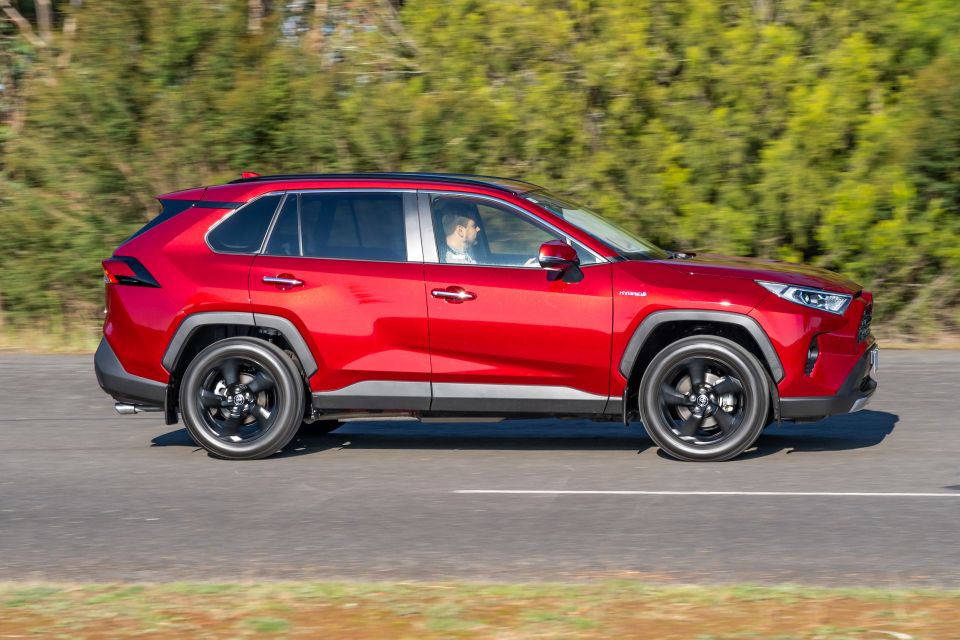
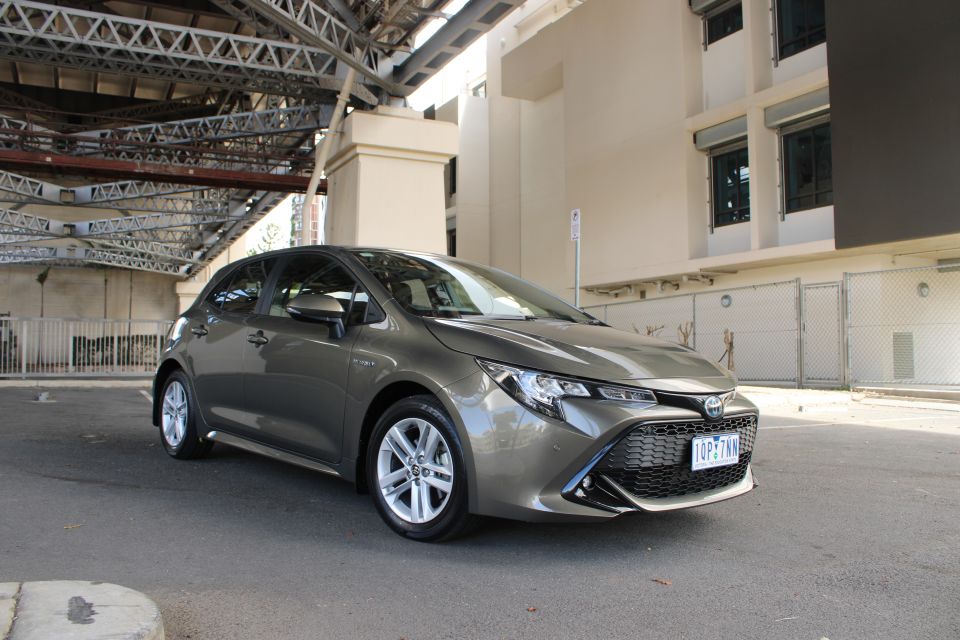
Toyota made nine of the top 25 models (separating the LandCruiser into 70/200 Series wagon, and cab chassis, tallies), and made the best-selling ute, SUV, and passenger vehicle.
Top 25 models by sales in May
| Model | Sales |
|---|---|
| Toyota HiLux | 3527 |
| Ford Ranger | 2663 |
| Toyota RAV4 | 2345 |
| Toyota Corolla | 1626 |
| Mazda CX-5 | 1479 |
| Toyota Prado | 1358 |
| LandCruiser wagon | 1260 |
| Hyundai i30 | 1191 |
| Mazda 3 | 1052 |
| Hyundai Tucson | 1019 |
| Isuzu D-Max | 1010 |
| Toyota Camry | 911 |
| Mazda CX-3 | 883 |
| LandCruiser cab chassis | 872 |
| Mitsubishi Triton | 866 |
| Holden Colorado | 855 |
| Kia Cerato | 842 |
| Mazda BT-50 | 823 |
| Toyota HiAce van/bus | 796 |
| Toyota C-HR | 789 |
| Nissan X-Trail | 768 |
| Volkswagen Golf | 742 |
| Hyundai Kona | 737 |
| Nissan Navara | 726 |
| Mitsubishi ASX | 725 |
In terms of segment breakdowns, Medium SUVs commanded the highest market share with 19.2 per cent, ahead of 4×4 Utes (18.3), Small Cars (13.0), Large SUVs (11.6), Small SUVs (11.2), Light and Micro Cars (4.0), Medium Cars (3.6), 4×2 Utes (3.2), Upper Large SUVs (3.0), and Light SUVs (2.9).
Segment leader tables
| 1st | 2nd | 3rd |
|---|---|---|
| Kia Picanto: 203 | Mitsu Mirage: 42 | Fiat 500: 37 |
| Suzuki Swift: 313 | MG 3: 302 | Kia Rio: 271 |
| Mini: 111 | Audi A1: 36 | Citroen C3: 4 |
| Toyota Corolla: 1626 | Hyundai i30: 1191 | Mazda 3: 1052 |
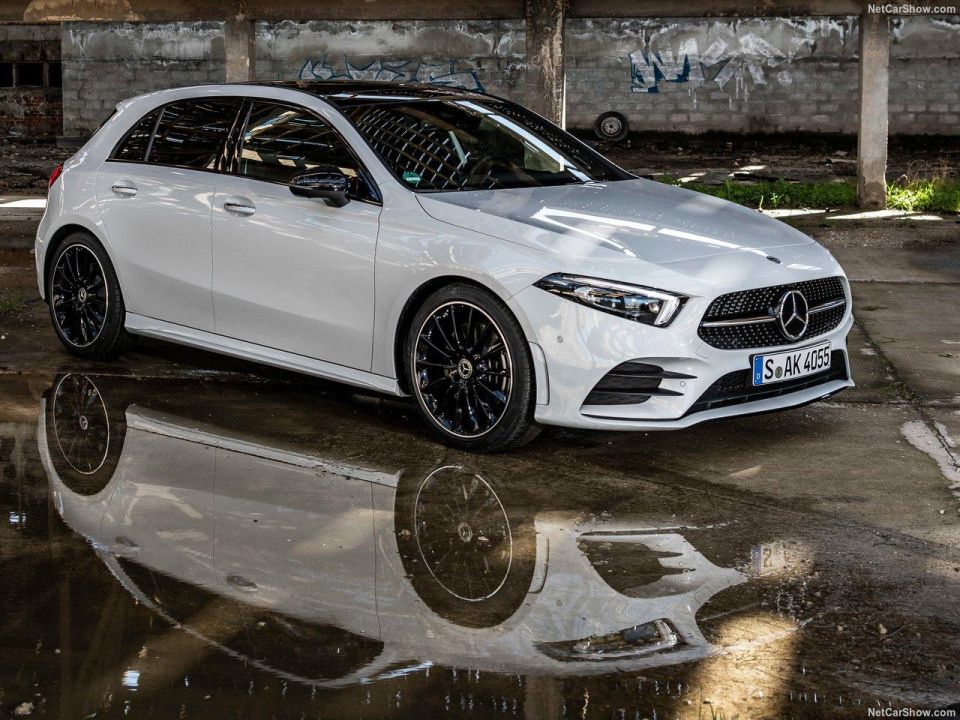
| MB A-Class: 352 | BMW 1: 194 | Audi A3: 168 |
| Toyota Camry: 911 | Mazda 6: 125 | Skoda Octavia: 94 |
| BMW 3: 268 | MB CLA: 174 | MB C-Class: 139 |
| Kia Stinger: 93 | Commodore: 40 | Skoda Superb: 15 |
| BMW 5: 57 | MB E-Class: 29 | Audi A6: 11 |
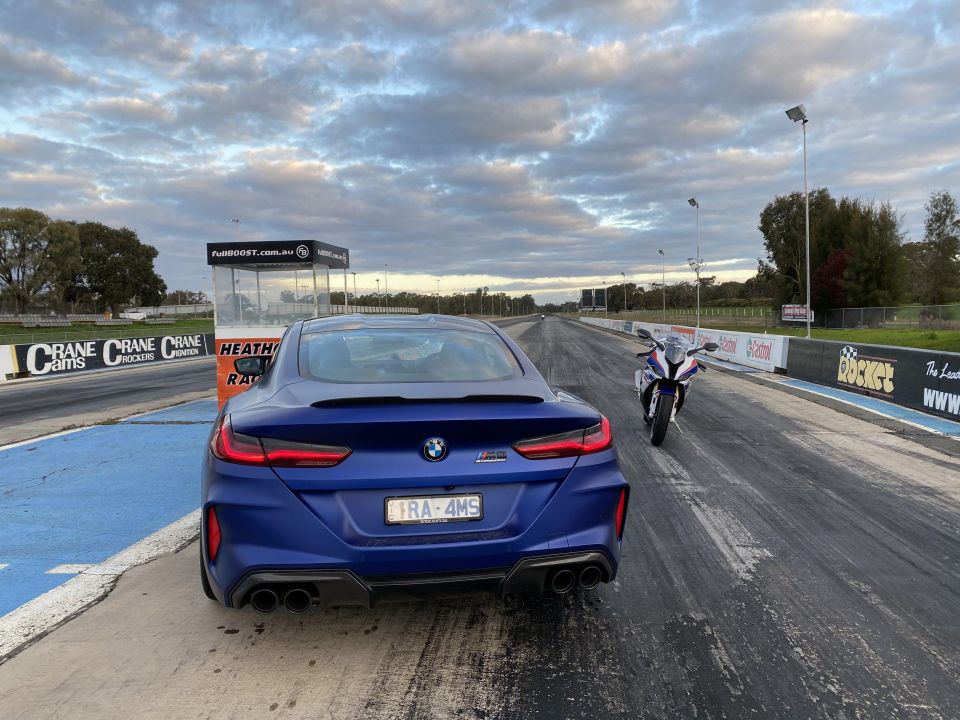
| BMW 8 GC: 14 | BMW 7: 10 | MB S-Class: 7 |
| Kia Carnival: 190 | Hyundai iMax: 68 | Honda Odyssey: 46 |
| Ford Mustang: 257 | MB C-Class: 75 | Toyota 86: 40 |
| Porsche 911: 30 | Ferrari: 20 | BMW 8 coupe: 9 |
| 1st | 2nd | 3rd |
|---|---|---|
| Mazda CX-3: 883 | Hyundai Venue: 246 | Holden Trax: 225 |
| Toyota C-HR: 789 | Hyundai Kona: 737 | Mitsu ASX: 725 |
| Audi Q3: 329 | Volvo XC40: 209 | BMW X1: 299 |
| Toyota RAV4: 2345 | Mazda CX-5: 1479 | Hyun Tucson: 1019 |
| BMW X3/X4: 565 | MB GLC/Coupe: 445 | Lexus NX: 246 |
| Toyota Prado: 1358 | Toyota Kluger: 541 | Mazda CX-9: 453 |
| BMW X5/X6: 322 | MB GLE/Coupe: 198 | Lexus RS: 142 |
| LandCruiser: 1260 | Nissan Patrol: 219 | |
| MB GLS: 77 | BMW X7: 75 | LR Discovery: 46 |
| 1st | 2nd | 3rd |
|---|---|---|
| VW Caddy: 133 | Renault Kangoo: 35 | Peugeot Partner: 11 |
| Toyota HiAce: 615 | Hyundai iLoad: 239 | Ford Transit C: 219 |
| HiLux 4×2: 727 | Isuzu D-Max 4×2: 348 | Maz BT-50 4×2: 246 |
| HiLux 4×4: 2800 | Ranger 4×4: 2499 | LandCruiser: 872 |
Breakdown by State/Territory:
Sales by sub total:
Sales by fuel:
Main sources of imports:
Do you have any questions you’d like to ask? Put them in the comments and we will answer.


Damion Smy
60 Minutes Ago

Josh Nevett
3 Hours Ago

Josh Nevett
3 Hours Ago

Damion Smy
3 Hours Ago

CarExpert.com.au
4 Hours Ago

James Wong
4 Hours Ago