Every month, we report the VFACTS new car sales figures for Australia. Well, now there’s a used car equivalent.
For the first time, the Australian Automotive Dealer Association (AADA) has shared what it’s calling the Automotive Insights Report (AIR) to provide an insight into the Australian used car market.
“Prior to the release of AIR there has been no reliable and regular dataset for the used car market, even though more than 65 per cent of all cars purchased in Australia are used cars,” said AADA CEO James Voortman.
“AADA has partnered with the used car market data specialists, AutoGrab, to provide regular market data which will serve as a valuable resource for Dealers, consumers, and enthusiasts interested in the used car market.
“The first edition of AIR shows that after a number of years of tight supply, Australia’s used car market is
seeing increased levels of stock with increases in the time it takes to sell a car and a gradual decline in retained values.”
How the figures are calculated
The figures are based on data about the number of used and dealer demonstrator cars listed as for sale around Australia at the start of the month, which are compared with the number of those listings that have been taken down at the end.
The AADA and AutoGrab offer the following definitions.
- For Sale: Level of available used and demo cars listed online by dealers and private sellers nationally at the time of reporting. AutoGrab processes and de-duplicates listings to identify and eliminate repetitions, ensuring that vehicles listed across multiple platforms are counted only once.
- Sales: Total vehicles delisted from online marketplaces, serving as a close proxy to actual sales and recorded monthly. The delisting count also reflects unique vehicles, as AutoGrab processes and deduplicates listings to identify and eliminate repetitions, ensuring that vehicles listed across multiple platforms are counted only once.
Used car sales figures for November 2023
According to the AIR data, a total of 303,732 vehicles were listed for sale in Australia. A total of 206,417 were sold.
The Northern Territory and Queensland were the only parts of Australia to see used car sales growth in November, relative to October.
| Listed | Sold | |
|---|---|---|
| ACT + NSW | 95,618 | 63,435 |
| VIC | 82,670 | 49,885 |
| QLD | 67,165 | 46,980 |
| WA | 31,392 | 25,856 |
| SA | 18,491 | 13,701 |
| TAS | 5994 | 4898 |
| NT | 2402 | 1663 |
| 303,732 | 206,417 |
The majority of vehicles sold were passenger cars (sedan, hatchbacks etc), followed by SUVs, with utes in third place.
| Listed | Sold | |
|---|---|---|
| Passenger | 110,390 | 86,985 |
| SUV | 125,055 | 78,097 |
| Utes | 57,771 | 35,064 |
| Vans and buses | 10,238 | 6094 |
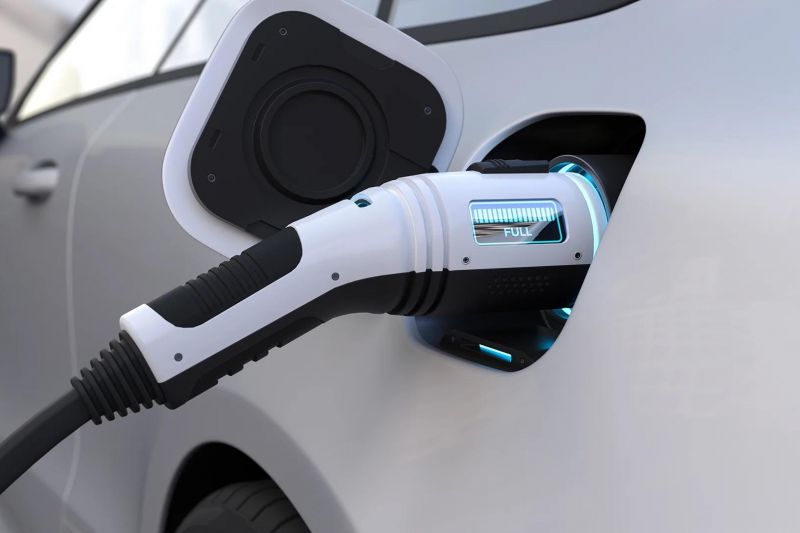
Petrol was the dominant fuel type, ahead of diesel. Hybrid vehicles account for a small slice of the used cars sold in November, while electric vehicles represent just 0.67 per cent of all used sales.
That’s no great surprise, given the car parc of electric vehicles is small relative to other fuel sources.
| Listed | Sold | |
|---|---|---|
| Petrol | 182,784 | 135,141 |
| Diesel | 106,666 | 62,813 |
| Hybrid | 10,139 | 6755 |
| Electric | 3826 | 1395 |
| LPG | 448 | 316 |
| PHEV | 303 | 156 |
The most popular used cars in Australia
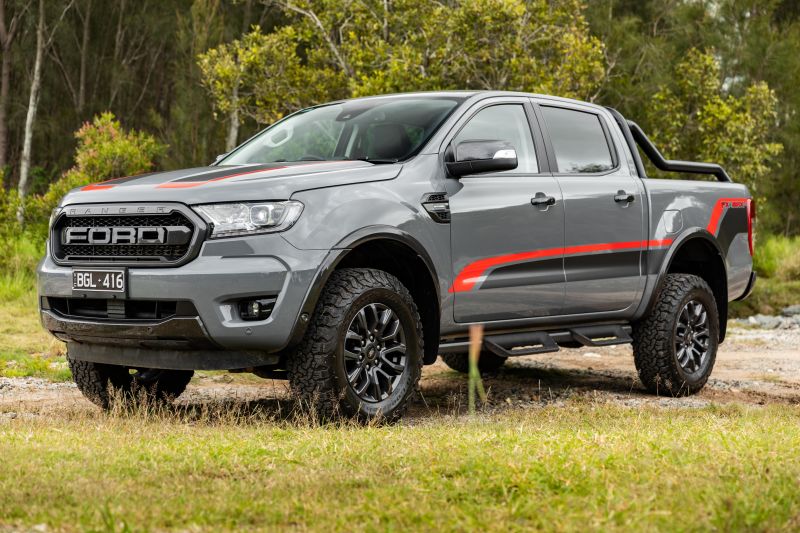
The Ford Ranger and Toyota HiLux are duking it out on the new car sales charts, and they’re neck-and-neck on the AIR used car charts as well.
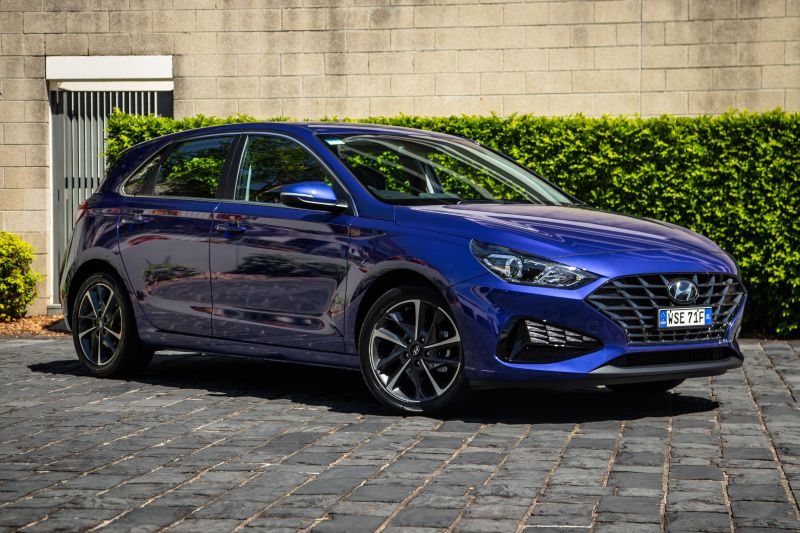
The Ranger was the most popular used car in Australia last month based on sales, ahead of the Toyota HiLux and Corolla, the Hyundai i30, and the Mazda 3.
Those best sellers aren’t necessarily the fastest to shift off dealer lots, or through private sales however. Of the vehicles below the Mazda 3 is the quickest to sell, while the LandCruiser Prado is the slowest.
| Sales | Average days to sell | |
|---|---|---|
| Ford Ranger | 4683 | 52.6 |
| Toyota HiLux | 4066 | 52.3 |
| Toyota Corolla | 3371 | 39.7 |
| Hyundai i30 | 2624 | 38.4 |
| Mazda 3 | 2354 | 35.9 |
| Mitsubishi Triton | 2324 | 42.6 |
| Toyota Camry | 2324 | 49.4 |
| Toyota RAV4 | 2159 | 45.2 |
| Mazda CX-5 | 2023 | 43.2 |
| Toyota Prado | 1849 | 53.7 |


