
Damion Smy
Hyundai teases Staria EV ahead of likely January reveal
Hyundai has shown a single teaser image and announced it will reveal its “biggest EV yet” at the 2026 Brussels Motor Show in Europe.
1 Hour Ago
Are you someone who can't rely on public transport for your daily commute? Research shows you're not alone, and it's worse than you think.

Marketplace Journalist

Marketplace Journalist
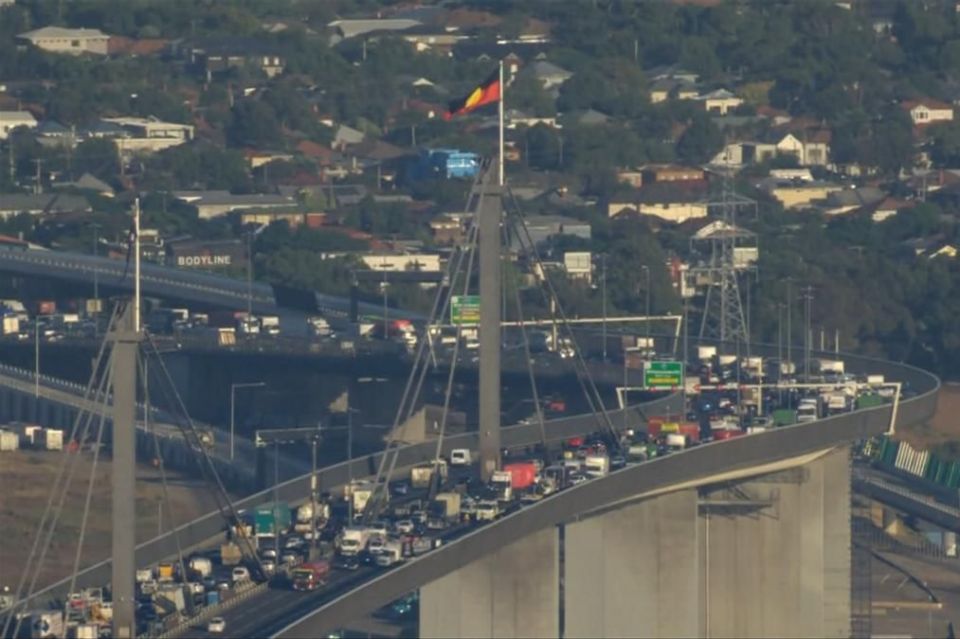
A new analysis has found one in two people in Australia’s five largest cities don’t live within walking distance of frequent and convenient public transport, keeping them reliant on their cars to get around.
Organised by the Climate Council lobby group, the analysis found seven million people living in Sydney, Melbourne, Brisbane, Perth, and Adelaide don’t have access to the “minimum level of public transport service required to get people out of cars”.
It defines that as public transport that runs every 15 minutes between 7am-7pm and within 800 metres of homes.
Of note, the analysis revealed access to frequent, convenient, and reliable public transport was generally worse in lower-income areas compared to wealthy suburbs in four of the five cities.
The exception is Sydney, where access is about the same for both high- and low-income areas.
Access to public transport across Australia’s largest cities:
| Sydney | Melbourne | Adelaide | Perth | Brisbane | |
|---|---|---|---|---|---|
| Population | 4.7 million | 4.6 million | 1.2 million | 2.0 million | 2.3 million |
| Population density | 2141 people per km² | 1592 people per km² | 1457 people per km² | 1188 people per km² | 1129 people per km² |
| Land area | 2194km² | 2881km² | 854km² | 1729km² | 2027km² |
| Population with all-day access to frequent services | 67.2% | 52.5% | 47.6% | 40.5% | 33.7% |
| Transport options used to travel to work | Public: 27% Active: 6% Private: 62% Other: 5% | Public: 18% Active: 6% Private: 71% Other: 6% | Public: 10% Active: 5% Private: 80% Other 5% | Public: 12% Active: 5% Private: 78% Other: 5% | Public: 14% Active: 5% Private: 75% Other: 6% |
| Service gap between high and low income areas | Access is about the same for both | Access is 27% lower in lower-income areas | Access is 19% lower in lower-income areas | Access is 18% lower in lower-income areas | Access is 27% lower in lower-income areas |
Data: Climate Council. Click the city headings to jump to their respective section in the article, or continue scrolling.
The group says its analysis presents a case for better investment in public transport in Australian cities, which it believes will increase ridership while cutting back air pollution.
Sydney was found to have the best access to public transport, with 67.2 per cent of its residents living in well-serviced areas. The worst is Brisbane at 33.7 per cent, which was recently reported to be Australia’s most traffic-congested city – ranked at 12th worst globally.
The New South Wales capital also has the highest population density of the five cities, though its public transport figures fall short of many cities elsewhere in the world. For example, The Guardian reports 82 per cent of people across New York City’s five boroughs live within 800 metres of a subway station.
Climate Council’s head of policy and advocacy, Jennifer Rayner, said there was “a big opportunity to improve our cities” by providing greater access to public transport.
“More shared and active transport is a win-win for millions of people who live in our biggest cities that slashes climate pollution from transport, cuts the cost of living, [and] makes our streets safer and less congested,” she said.
Active transport refers to methods like walking and cycling, while shared transport includes public transport like buses and trains but also rideshare services like Uber.
In preparing its report, the lobby group used General Transit Feed Specification (GTFS) data for each of the five cities. That data includes details of all of a city’s public transport stops, routes, and timetables, from which frequency and availability data was derived for a standard weekday.
The group then assessed stop frequencies in both directions across two-hour intervals throughout the day (5am to 7am, 7am to 9am, etc).
Frequent stops were deemed those serviced by eight or more trips in at least one direction during a given two-hour interval, or an average of one trip every 15 minutes.
Researchers then produced software-generated catchments based on an 800-metre walking distance from each stop, excluding areas limited by freeways and railways without pedestrian crossings.
The Climate Council sourced population data from the 2021 Census, from which serviced populations were identified through geographic size, population size, and land use categorisation.
These assessments took into consideration differences between high- and low-density residential areas and sparsely populated commercial and industrial areas, to ensure the findings painted a fair, representative image.
The group recommended all levels of government should further plan and invest in public and active transport, while streets should be made more friendly for pedestrians and cyclists.
Additionally, the group believes state and territory governments should aim to make cities better connected, compact, and efficient through the construction of new housing and commercial developments in already established suburbs, while also creating zones where only shared transport vehicles are allowed to travel through.
Here’s a breakdown of the Climate Council’s analysis findings for each of the five cities.
Sydney is the best covered of the five cities analysed, with 67.2 per cent of its population having access to public transport good enough to rely on for commuting.
The analysis found access is best in Sydney’s central business district, Botany, and the eastern suburbs, while it’s worst in the Blue Mountains, Penrith, and Campbelltown.
Access to good public transport ends around 25km from the CBD for most people, and there’s virtually no difference in access between high- and lower-income suburbs.
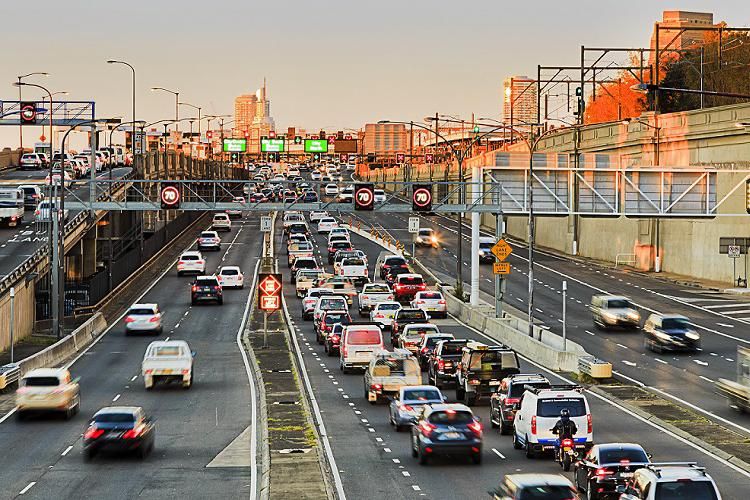
As with the rest of the cities analysed, the vast majority of Sydneysiders use a private vehicle to travel to work at 62 per cent. 27 per cent use public transport, while six per cent choose to walk or ride a bike.
| Sydney | |
|---|---|
| Population | 4.7 million |
| Population density | 2141 people per km² |
| Land area | 2194km² |
| Population with all-day access to frequent services | 67.2% |
| Transport options used to travel to work | Public: 27% Active: 6% Private: 62% Other: 5% |
| Service gap between high and low income areas | Access is about the same for both |
Victoria’s capital ranks second-best for access to good public transport, though the percentage has fallen to 52.5 per cent.
As is expected it was revealed Melbourne’s CBD is the best covered region in the city, followed by Albert Park and South Yarra. Areas with the worst availability include Cardinia, Mornington Peninsula, and Fawkner.
Access to good public transport ends 15km from the CBD for most people, 10km less than it does in Sydney. Access is also 27 per cent lower in Melbourne’s lower income suburbs compared to wealthy areas.
Additionally, 71 per cent of residents use a private vehicle to travel to work, while 18 per cent take public transport. The number of people choosing to walk or ride to work matches Sydney at six per cent.
| Melbourne | |
|---|---|
| Population | 4.6 million |
| Population density | 1592 people per km² |
| Land area | 2881km² |
| Population with all-day access to frequent services | 52.5% |
| Transport options used to travel to work | Public: 18% Active: 6% Private: 71% Other: 6% |
| Service gap between high and low income areas | Access is 27% lower in lower income areas |
Slightly behind Melbourne is Adelaide, where 47.6 per cent of people have access to all-day frequent services.
Among the best-covered areas are Adelaide’s CBD, Prospect, Walkerville, and Unley, while the areas with the worst access include Onkaparinga, Playford, and Port Adelaide.
It’s tied for the smallest area of good public transport services, as access ends eight kilometres from the Adelaide CBD for most people. Besides Sydney it also has one of the smaller disparities between high- and lower-income suburbs at 19 per cent.
Adelaide, however, has the highest percentage of people who choose to drive a private vehicle to work, while only 10 per cent of people take public transport. Five per cent of people prefer to walk or ride.
| Adelaide | |
|---|---|
| Population | 1.2 million |
| Population density | 1457 people per km² |
| Land area | 854km² |
| Population with all-day access to frequent services | 47.6% |
| Transport options used to travel to work | Public: 10% Active: 5% Private: 80% Other 5% |
| Service gap between high and low income areas | Access is 19% lower in lower income areas |
Perth ranks second-from-last for the percentage of people who have access to good public transport, as the analysis revealed only 40.5 per cent of residents are adequately catered for.
The areas with the best public transport availability are Perth’s CBD, Belmont, Victoria Park, and Fremantle, while named among the worst are Kwinana, Mandurah, and Armadale.
Coverage for good public transport ends 12km from the CBD for most people, and the disparity in access between high- and lower-income suburbs is marginally better than Adelaide at 18 per cent.
78 per cent of people choose to drive a private vehicle to work, 12 per cent take public transport, and five per cent prefer to do some form of active transport.
| Perth | |
|---|---|
| Population | 2.0 million |
| Population density | 1188 people per km² |
| Land area | 1729km² |
| Population with all-day access to frequent services | 40.5% |
| Transport options used to travel to work | Public: 12% Active: 5% Private: 78% Other: 5% |
| Service gap between high and low income areas | Access is 18% lower in lower income areas |
As Australia’s most traffic-congested city, only one third (33.7 per cent) of Brisbane’s residents have access to all-day frequent services.
It ranks last in the Climate Council’s analysis. Among the areas with the best public transport availability are Brisbane’s inner suburbs, Annerley, Yeronga, and Indooroopilly, while the worst are the suburbs in the Hills District in Brisbane’s west, as well as Browns Plains and Beenleigh on the southside.
Like Adelaide, access to good public transport ends only eight kilometres from Brisbane’s CBD. It also matches Melbourne, as access is 27 per cent lower in lower-income suburbs compared to wealthy areas.
Exactly three quarters of its residents drive a private vehicle to work, while 14 per cent take public transport and five per cent choose to walk or ride.
| Brisbane | |
|---|---|
| Population | 2.3 million |
| Population density | 1129 people per km² |
| Land area | 2027km² |
| Population with all-day access to frequent services | 33.7% |
| Transport options used to travel to work | Public: 14% Active: 5% Private: 75% Other: 6% |
| Service gap between high and low income areas | Access is 27% lower in lower income areas |
Data sourced from the Climate Council’s ‘Next Stop Suburbia’ report, available here.
MORE: The Australian city with the worst traffic isn’t Sydney or Melbourne
Max Davies is a CarExpert journalist with a background in regional media, with a passion for Japanese brands and motorsport.
Damion Smy
1 Hour Ago
Damion Smy
5 Hours Ago
Damion Smy
6 Hours Ago
Damion Smy
7 Hours Ago

Damion Smy
7 Hours Ago

Josh Nevett
7 Hours Ago