Few things avoid change, not least Australia’s highly competitive new vehicle market.
We thought it would be interesting to take a snapshot comparing 2013 to 2022, getting some insights into how the market looks a decade later.
Principally, we’re looking at brands that gained and lost the most sales and market share from one year to the other.
Market-wide sales in 2013 (1.14 million units) were 4.8 per cent higher that 2022 (1.08 million), more reflective of supply shortages than reduction in demand.
The type of vehicles being bought in the greatest numbers now differs considerably to 2013.
That year 49.9 per cent of all sales were classified as passenger cars, meaning hatchbacks, sedans, wagons, coupes and people movers. This fell to just 18.8 per cent in 2022.
At the same time the market share of SUVs spiked from 29.4 per cent of the market in 2013 to 53.1 points last year. Utes and vans grew their share from 18.0 to 23.7 per cent.
Brands in the market during 2013 (one of the final years of local car manufacturing) that have exited include Holden first and foremost, which had 9.9 per cent share that year.
There were also the lower-volume Chrysler, Dodge, Opel, Proton, Infiniti and Smart brands.
On the flip-side, nearly 10 per cent of the new vehicles sold in Australia during 2022 were made by a brand that had no meaningful presence in Australia just 10 years ago.
These include MG (4.6 per cent share last year) and Tesla (1.8), but also LDV (1.5), Ram (0.6), Chevrolet and BYD (both 0.2); and Polestar, Cupra and Genesis (all 0.1).
There are two ways to look at which brands had the most growth comparing 2013 to 2022, namely changes in market share and overall sales.
In overall sales volume terms the brand that sold the highest additional number of cars in 2022 compared to 2013 was a brand that wasn’t here at all in 2013: MG. The Chinese brand has raced into the top 10 over the past few years, recording a record 49,852 units in 2022.
| Brand | 2013 sales | 2022 sales | Increase |
|---|---|---|---|
| MG | 0 | 49,582 | 49,582 |
| Kia | 29,778 | 78,330 | 48,552 |
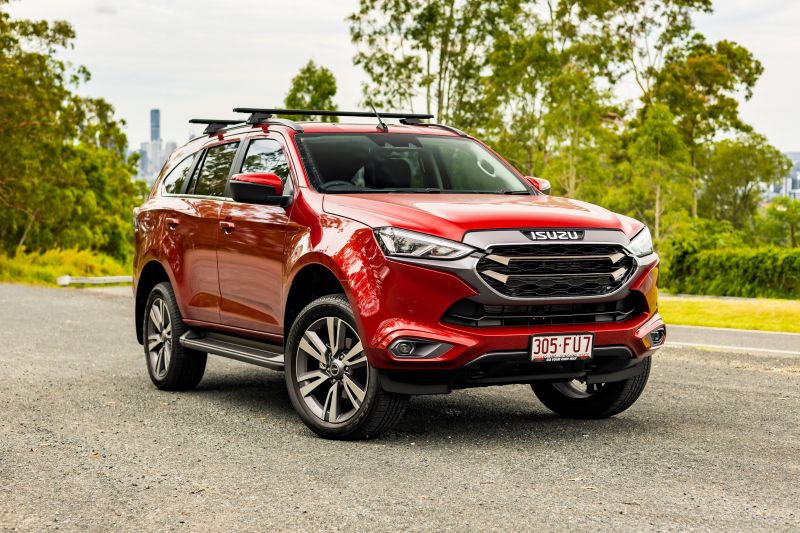
| Isuzu Ute | 10,209 | 35,323 | 25,114 |
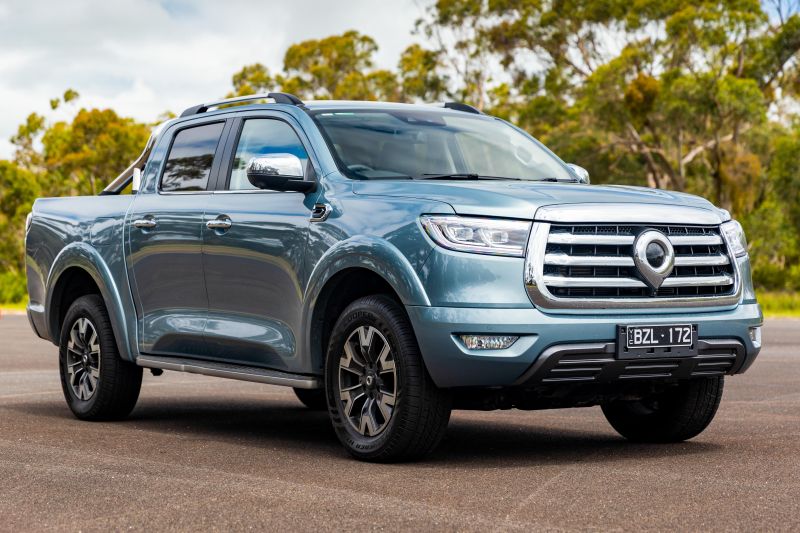
| GWM | 6105 | 25,042 | 18,937 |
| Tesla | 0 | 19,594 | 19,594 |
The next best performers were two fellow top 10 players in the form of Kia (recording huge growth over the past decade, from under 30,000 cars in 2013 to nearly 80,000 in 2022) and Isuzu Ute (more than tripling its sales from about 10,000 in 2013 to 35,000 units in 2022.
Note also the growing presence of GWM and Tesla, rounding out the top 5 table.
Another way to look at things is to see which brands grew their market share by the highest percentage, which discounts brands that sold zero cars in 2013. The leader here was Great Wall, now called GWM and inclusive of the Haval brand. Its market share grew from 0.5 share points in 2013 to 2.3 in 2022.
| Brand | 2013 share % | 2022 share % | Change % |
|---|---|---|---|
| GWM | 0.5 | 2.3 | +360.0 |
| Ssangyong | 0.1 | 0.4 | +300.0 |
| Isuzu Ute | 0.9 | 3.3 | +266.7 |
| Kia | 2.6 | 7.2 | +176.9 |
| Porsche | 0.2 | 0.5 | +150.0 |
Isuzu Ute upped its market share from 0.9 per cent in 2013 to 3.3 per cent in 2022, while Kia took its share from 2.6 per cent to 7.2 per cent. This pair gained the most share points overall (4.6 points and 2.4 points) by way of their larger volumes.
But in percentage terms the number-two performer was lower-volume SsangYong, which grew its overall market share from 0.1 per cent to 0.4 per cent having broadened its product range and likewise switched to a factory-backed distributor business model.
Next best by market share gains were premium players Porsche (0.2 per cent share in 2013 to 0.5 per cent in 2022) and Volvo (0.5 per cent to 1.0 per cent). Like Volvo, Skoda doubled its share, in this case from 0.3 per cent to 0.6 per cent.
| Brand | 2013 sales | 2022 sales | Decrease |
|---|---|---|---|
| Holden | 112,059 | 0 | -112,059 |
| Nissan | 76,733 | 26,491 | -50,242 |
| Honda | 39,258 | 14,215 | -25,043 |
| Volkswagen | 54,892 | 30,946 | -23,946 |
| Hyundai | 97,006 | 73,345 | -23,661 |
On the flip side are those brands with the great drop in sales in 2022 against 2013. Again, while there are peaks and troughs over the interim period, this gives an interesting snapshot.
Unsurprisingly the biggest drop-off is Holden, with the Lion brand’s demise making a huge impact on the respective years compared. Brands with a presence in both years that lost the most volume were Nissan, Honda, Volkswagen and Honda.
Naturally there are factors behind this. Nissan ran out of SUV stock during 2022 before the new-generation models arrived, making last year a particularly poor year for the brand. But the longer term trend is downwards.
| Brand | 2013 share % | 2022 share % | Change % |
|---|---|---|---|
| Fiat | 0.4 | 0.1 | -75.0 |
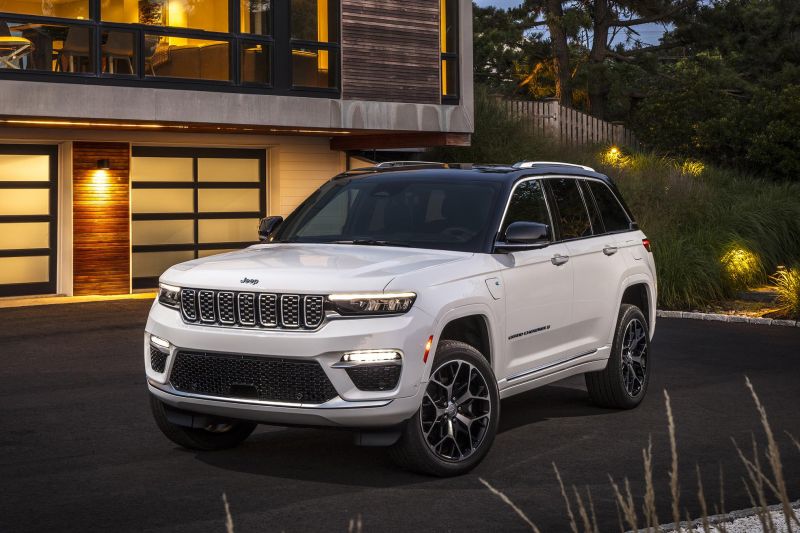
| Jeep | 2 | 0.6 | -70.0 |
| Nissan | 6.8 | 2.4 | -64.7 |
| Honda | 3.5 | 1.3 | -62.9 |
| Peugeot | 0.4 | 0.2 | -50.0 |
Honda between these two years switched to a set-price business model centred around a reduced model range emphasising high-spec variants. While the company forecast a drop in sales and share points, it has fallen short of its stated target.
Volkswagen was hit by a lack of semiconductors and Europe-wide supply chain problems last year, but appears to be bouncing back in 2023 with deliveries up 66 per cent so far.
The other major brand that has fallen away is Hyundai, which has shrunk its volumes while Kia has grown at pace – culminating in the latter outselling the former in 2022.
In terms of reduced market share, this measure shows up Jeep’s reduced market presence, from 2.0 per cent market share to 0.6 per cent, a result of unfavourable USD to AUD exchange rates and a trimmed-back range of models (only partly emergent, also down to global forces).
Brands in 2013 data that did not have a meaningful presence here in 2022 included:
- Holden
- Chrysler
- Dodge
- Opel
- Chery
- Proton
- Infiniti
- Smart
On the flip side, brands that had a market presence in 2022 that weren’t here in a meaningful way in 2013 included:
- MG
- Tesla
- LDV
- Ram
- Chevrolet
- BYD
- Polestar
- Cupra
- Genesis
