
William Stopford
3 Days Ago
Australia's used vehicle market has started to cool down, and it's not just because buyers are spending their money on Christmas presents.

Contributor

Contributor
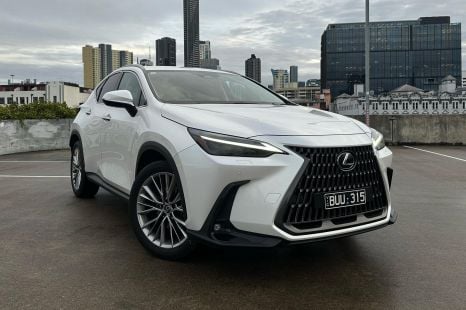
Used vehicle sales in Australia have taken a dip compared to recent record months, and the increase in supply of – and negotiable discounts for – new cars is pinned as a major factor.
Data compiled by AutoGrab and published by the Australian Automotive Dealer Association (AADA) shows 197,652 used vehicles were sold during November, a 2.3 per cent decrease on the month prior.
It’s the third month of decline since July, and the seventh month in which used vehicle sales have been below 200,000 since the AADA’s Automotive Insights Report (AIR) debuted at the end of 2023.
100s of new car deals are available through CarExpert right now. Get the experts on your side and score a great deal. Browse now.
“This trend is likely to persist as more affordable new vehicles enter the market, prompting buyers to upgrade sooner and increasing the supply of used cars, which will affect price sensitivity,” said AADA CEO James Voortman.
For the second month in a row – and only the second time since the AIR report was first published – SUVs were once again the biggest-selling vehicle type, despite sales of these models dropping by more than the market average.
After the average time to sell a used car rose to 49 days in October, the longest period seen so far this year, this number decreased slightly to 47 days in November, staying comfortably below the record high of 50.9 days in December 2023.
Used vehicle sales fell in every state and territory except Tasmania and the Northern Territory, as Western Australia suffered the largest decrease despite a large uptick in listings.
When it comes to powertrains, all types decreased in sales, with electric vehicles (EVs) and plug-in hybrids (PHEVs) suffering the most despite recent increases. Hybrid sales proved to be the most stable.
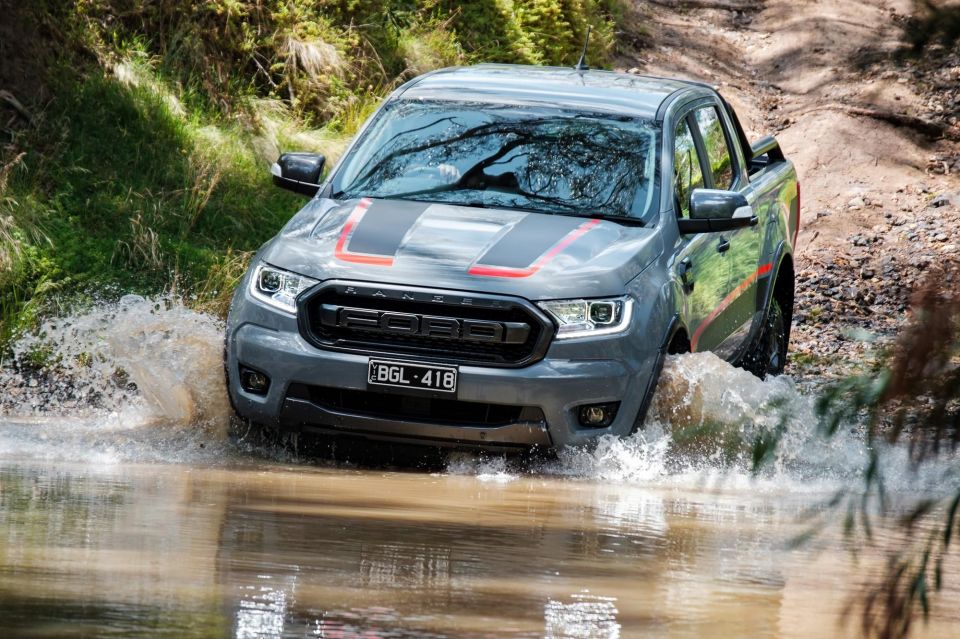
The Ford Ranger continued to be the best-selling used vehicle, with 5431 examples sold, down 5.3 per cent on the month prior.
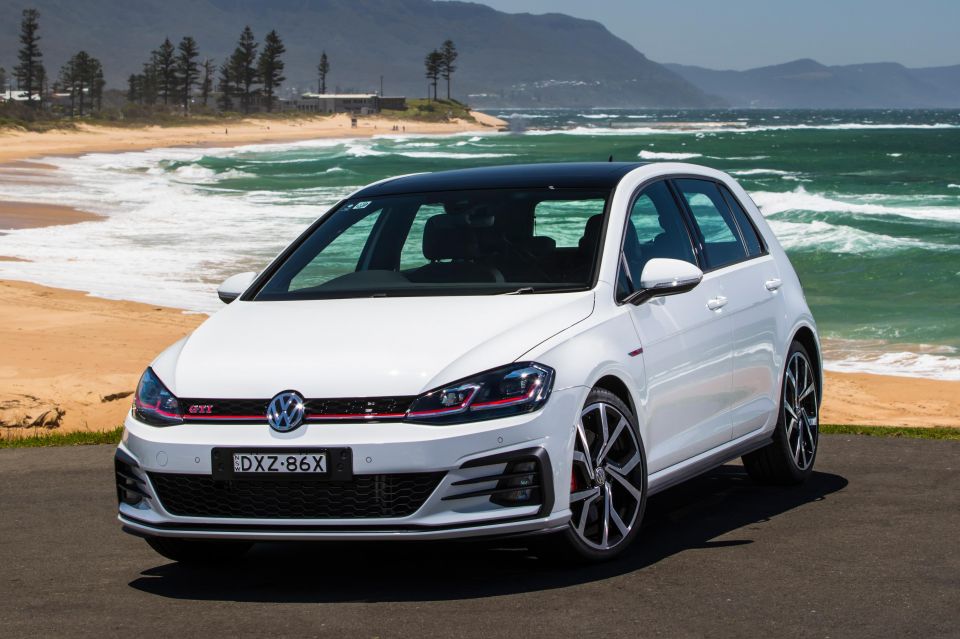
At the bottom of the top 10 table, the Volkswagen Golf and Nissan Navara traded places once again, with the German hatch making the ranks once again.
The AADA and AutoGrab offer the following definitions for the monthly Automotive Insights Report:
| Model | Sales (November 2024) | Change from October | Average days to sell |
|---|---|---|---|
| Ford Ranger | 5431 | -5.3% | 50.0 |
| Toyota HiLux | 4131 | -1.5% | 39.5 |
| Toyota Corolla | 3380 | -2.0% | 37.2 |
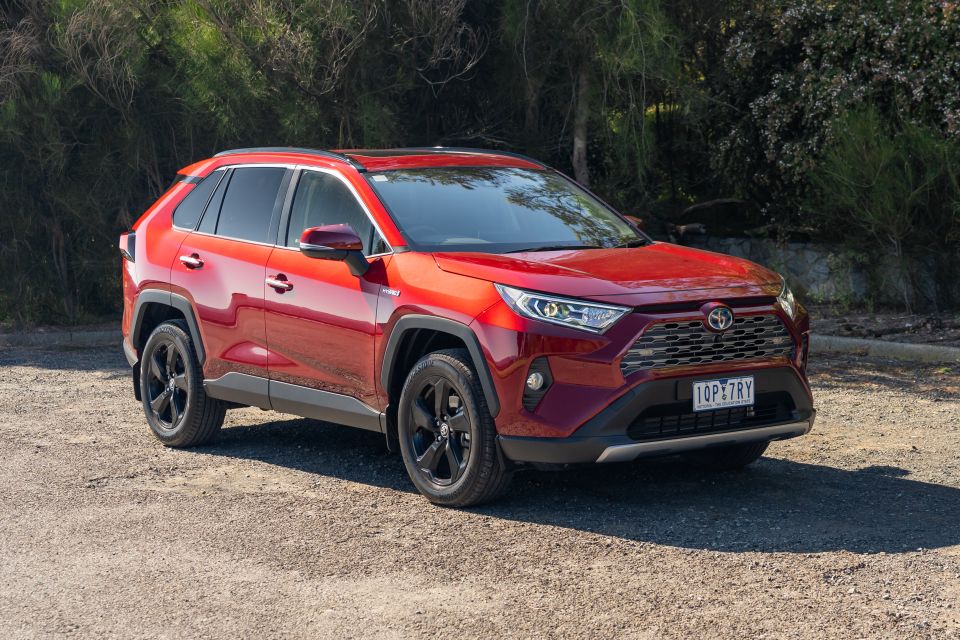
| Toyota RAV4 | 2552 | -8.6% | 43.9 |
| Hyundai i30 | 2433 | -4.2% | 39.8 |
| Mitsubishi Triton | 2407 | -5.0% | 49.1 |
| Toyota Camry | 2274 | -3.4% | 48.9 |
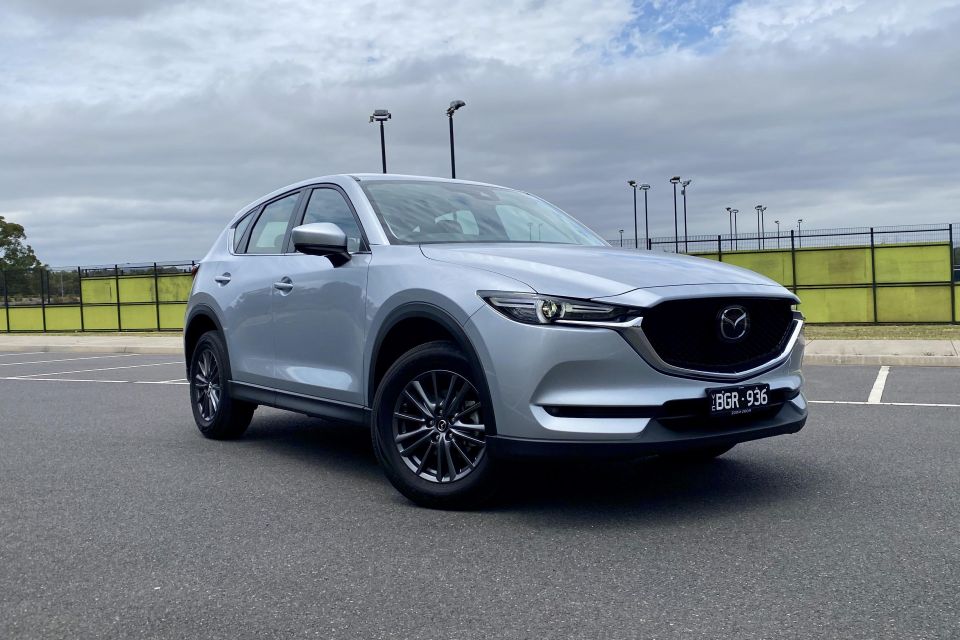
| Mazda CX-5 | 2151 | -0.6% | 48.3 |
| Mazda 3 | 2024 | -4.5% | 35.0 |
| Volkswagen Golf | 1675 | +1.2% | 54.1 |
| State/territory | Vehicles listed | Vehicles sold |
|---|---|---|
| New South Wales | 97,182 (+4.5%) | 56,561 (-1.3%) |
| Victoria | 90,260 (+5.4%) | 48,379 (-2.2%) |
| Queensland | 74,294 (+2.9%) | 45,573 (-3.2%) |
| Western Australia | 38,441 (+12.2%) | 25,810 (-5.8%) |
| South Australia | 22,956 (+9.5%) | 13,839 (-0.4%) |
| Tasmania | 6677 (+7.3%) | 4572 (+2.0%) |
| Australian Capital Territory | 4079 (-0.5%) | 2079 (-1.0%) |
| Northern Territory | 1259 (-12.3%) | 839 (+30.5%) |
| Total | 335,148 (+5.4%) | 197,652 (-2.3%) |
| Vehicle type | Listed for sale | Total sales |
|---|---|---|
| SUVs | 139,882 (+6.5%) | 80,365 (-2.6%) |
| Passenger cars | 119,642 (+4.6%) | 76,191 (-2.2%) |
| Utes | 62,458 (+4.4%) | 34,734 (-2.7%) |
| Vans and buses | 13,166 (+6.6%) | 6362 (1.5%) |
| Vehicle type | Sales (November 2024) | Change from October |
|---|---|---|
| Petrol | 124,614 | -1.6% |
| Diesel | 61,552 | -3.6% |
| Hybrid | 8763 | -1.7% |
| Electric vehicles (EV) | 2154 | -8.3% |
| Plug-in hybrid (PHEV) | 300 | -7.4% |
| LPG | 269 | -4.3% |
MORE: Used SUV sales overtake passenger cars for the first time as market slows MORE: Used car sales rebound in “a buyer’s market” MORE: Hybrids defy slowing used car market MORE: Used car sales skyrocket as prices come down MORE: How used car sales are booming in Australia MORE: Used vehicle sales surge in Australia, driving down prices for buyers MORE: Used car sales April 2024: Hybrids and EVs defy slow market MORE: Used car sales March 2024 – Market up, EVs see big gains MORE: Used car sales drop, but they’re selling more quickly MORE: Used car sales rise in strong start to 2024 MORE: Used EV, PHEV sales drop even as demand for new ones grows MORE: Australia’s best-selling used cars in December 2023 MORE: Australia’s used car sales results for 2023 revealed
Born and raised in Canberra, Jordan has worked as a full-time automotive journalist since 2021, being one of the most-published automotive news writers in Australia before joining CarExpert in 2024.


William Stopford
3 Days Ago

James Wong
3 Days Ago


Alborz Fallah
2 Days Ago

Max Davies
2 Days Ago

William Stopford
2 Days Ago

Andrew Maclean
1 Day Ago