
Matt Campbell
Good
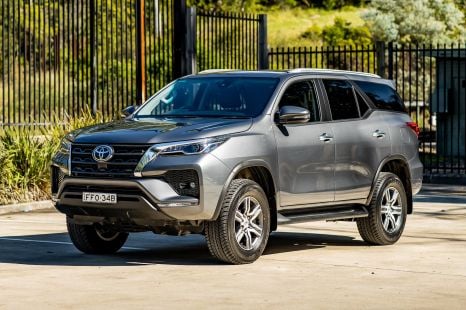
2025 Toyota Fortuner GXL review
This rugged Toyota HiLux-based off-road SUV has seven seats and a strong diesel engine, but it’s really feeling its age in 2025.
5 Days Ago
It was a record May, with the HiLux, Ranger and Model Y topping the charts despite ongoing Toyota wait time woes.

Senior Contributor
Senior Contributor
Strong backorder deliveries drove the Australian new vehicle market to an all-time May sales record and the best monthly result this year, with 105,694 new cars delivered.
This figure is up 12 per cent year-on-year (YoY), and has driven the market’s year-to-date (YTD) tally to 456,833 sales, up 4.3 per cent and the best status since 2018.
All states and territories saw an increase, with significant growth in WA (25.1 per cent) and Queensland (17.4 per cent) most noteworthy.
| Year | May sales | Jan-May sales |
|---|---|---|
| 2023 | 105,694* | 456,833 |
| 2022 | 94,383 | 437,884 |
| 2021 | 100,809 | 456,804 |
| 2020 | 59,894 | 332,181 |
| 2019 | 92,561 | 436,649 |
| 2018 | 100,754 | 475,222* |
| 2017 | 102,901 | 465,381 |
| 2016 | 96,672 | 469,571 |
| 2015 | 93,327 | 452,577 |
| 2014 | 94,562 | 441,642 |
Growth was recorded in all buyer type market segments: Private, business, government and rental, with the fleet sector growing at a faster clip due in part to stock arrivals, and tax breaks such as the FBT exemption for EVs and the (soon-to-change) instant asset write-off scheme.
There were 26.8 selling days in May 2023 compared to 25.8 in May 2022, therefore this resulted in an increase of 285.6 vehicle sales per day.
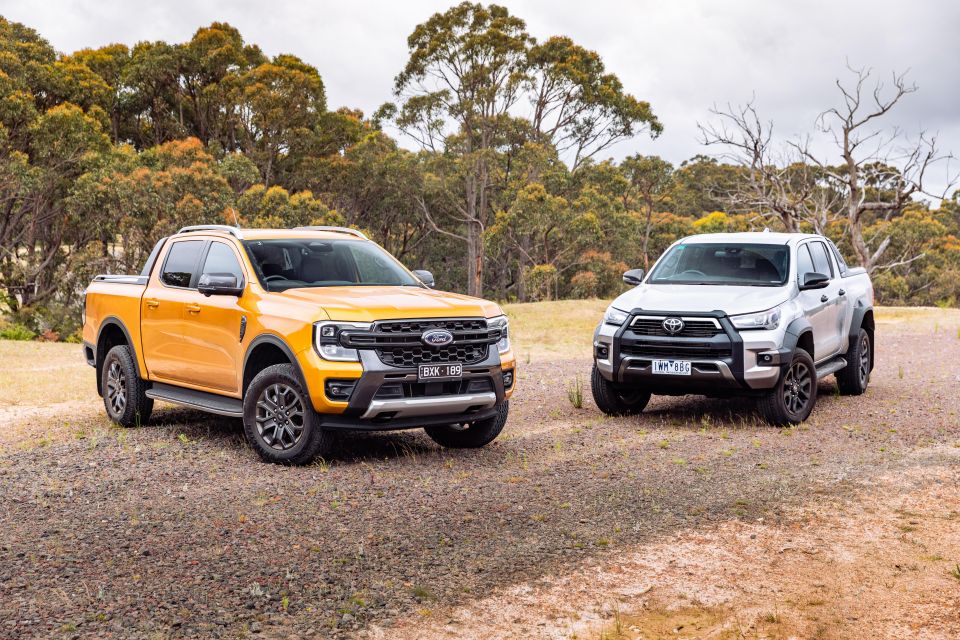
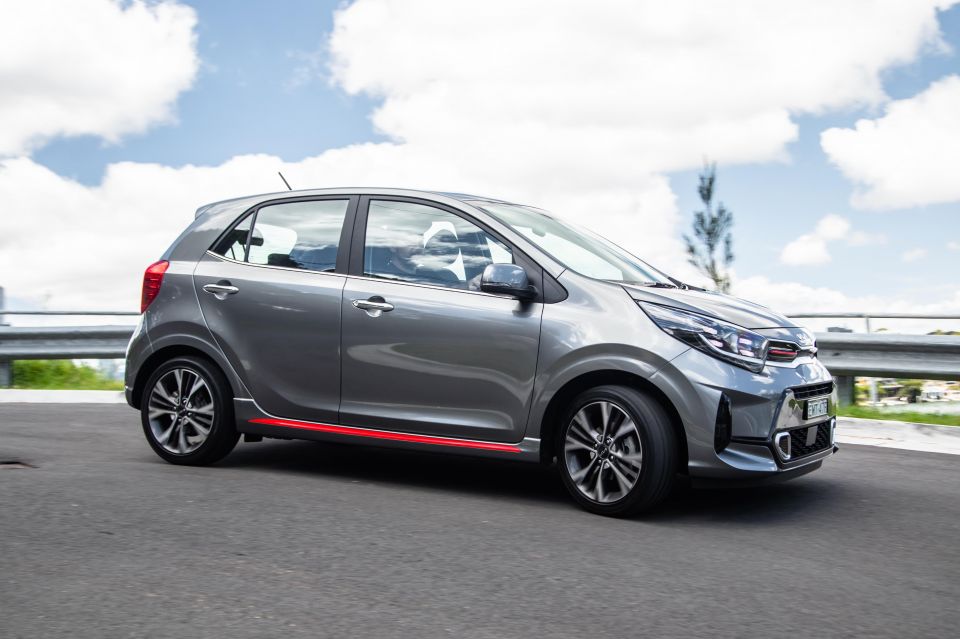
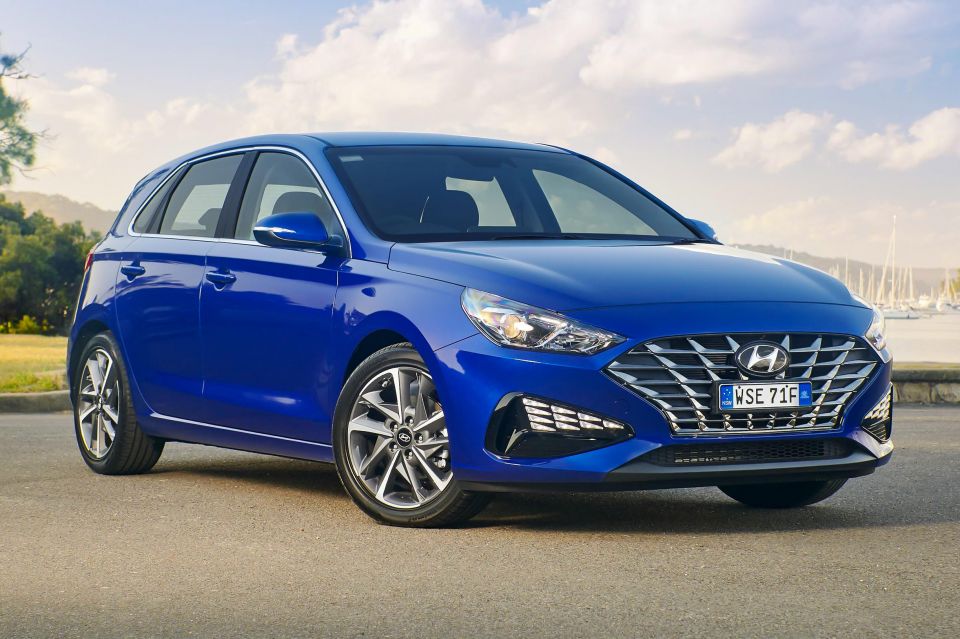
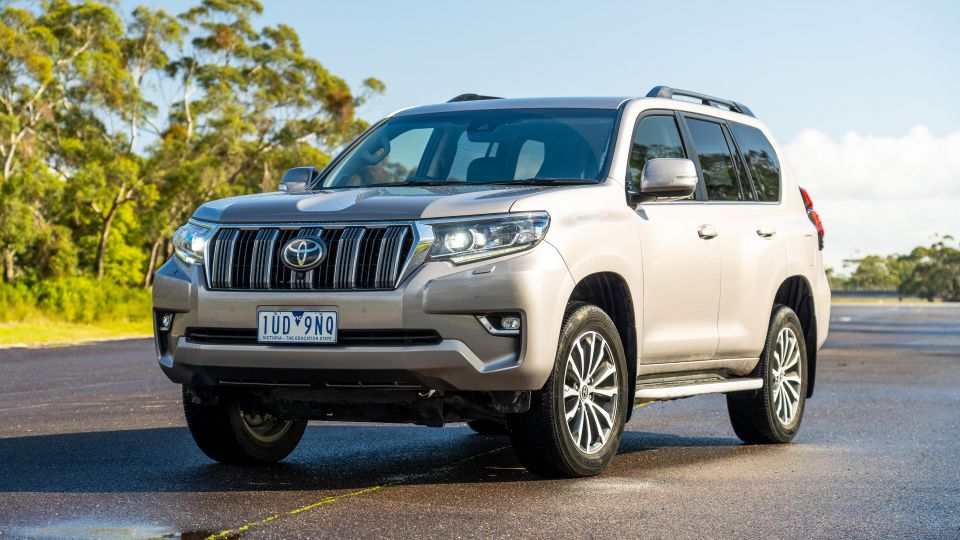
Toyota declined 20 per cent as its supply woes lingered (market share down to 17.4 per cent) but it remained well out in front, ahead of Mazda, Hyundai, Kia and Ford in that order.

For those who’ve not been paying attention lately, there are plenty of newer brands entrenched at the pointier end of the sales chart such as MG (sixth), Tesla (eighth), and GWM (12th).
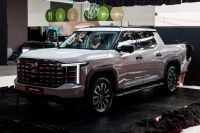
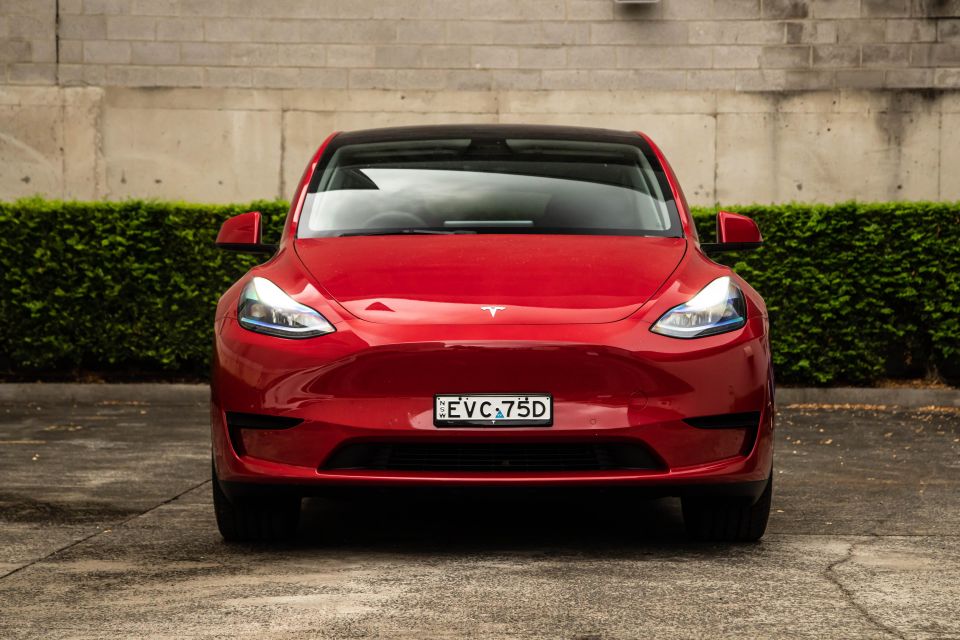
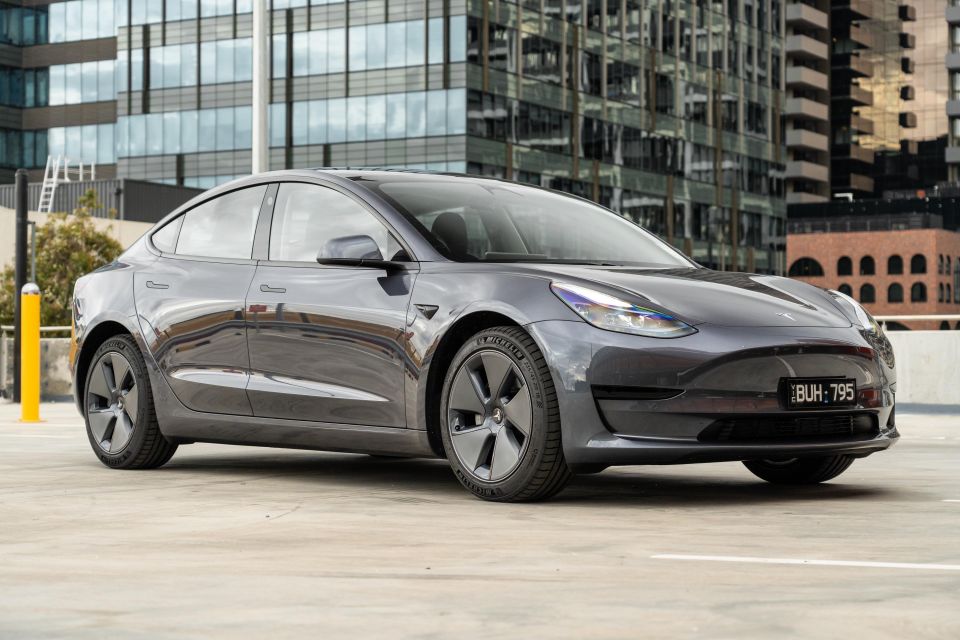
The Toyota HiLux and Ford Ranger remained the two top-selling vehicles as has become the norm, with the incredibly successful Tesla Model Y in third – ahead of the Toyota RAV4 and MG ZS.
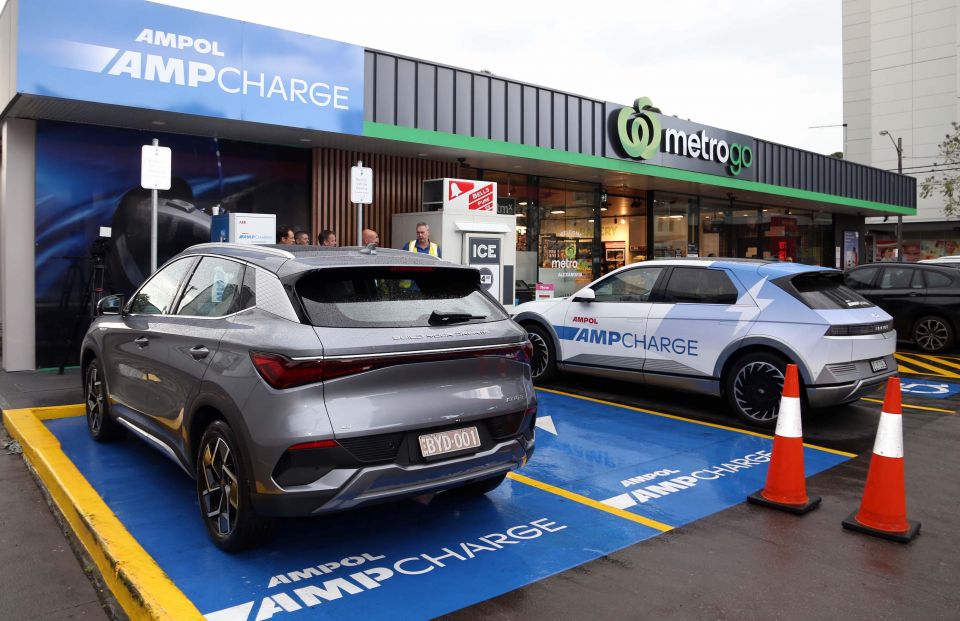
Tesla was the driving force (alongside BYD) behind the overall light vehicle market share for EVs of 8.0 per cent – four-fold share growth YTD. Electrified vehicles (EVs and hybrids) made up 15.6 per cent of the total market.

“This result is a signal that we are starting to see some improvement in supply,” said head of the Federal Chamber of Automotive Industries Tony Weber.
“However, not all issues are resolved, and our members continue to work with their customers to improve delivery times.”
Mr Weber added that while vehicle supply issues might be beginning to ease, the industry remained cautious around broader economic conditions and their potential impact on demand.
“A large proportion of vehicles delivered this month would have been ordered during 2022. Since then, we have seen a shift in economic conditions with a focus on rising cost pressures for households and businesses. Nevertheless, reports from our members indicate that demand remains firm.”
Market-leader Toyota’s sales fell away once again on the back of supply shortages, with its YTD market share now down to 15.6 per cent (it was 22.6 per cent this time last year).
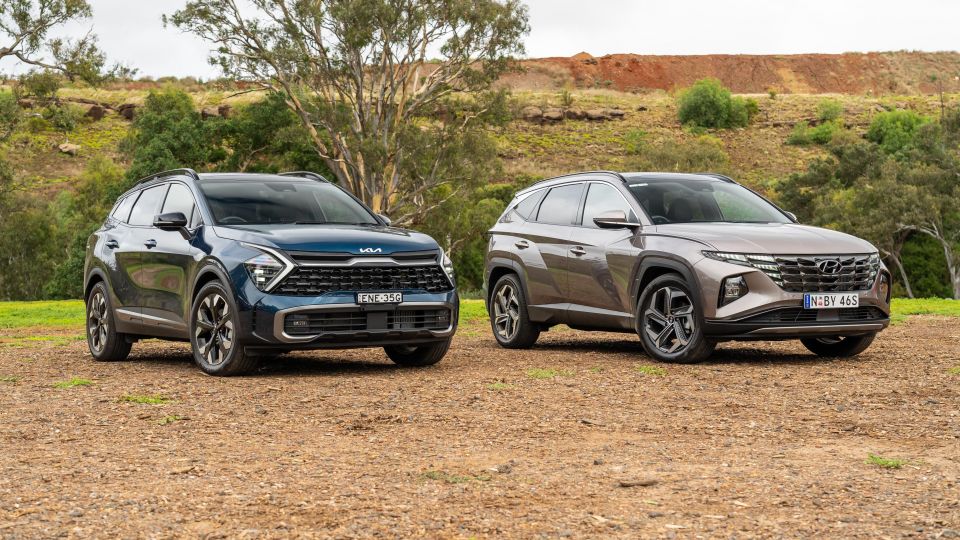
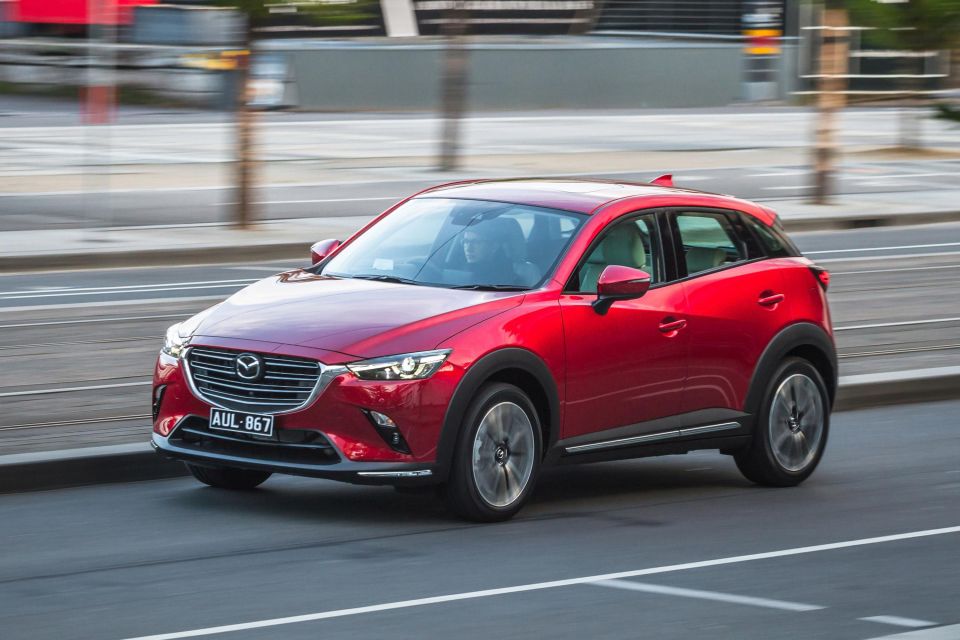
Mazda finished comfortably in second with strong monthly growth, with Hyundai edging its sibling brand Kia by a whisker into third. Rounding out the top five brands list was Ford.
MG edged Mitsubishi (down 25 per cent) into sixth, ahead of Tesla which topped both segments it competes in (premium mid-sized sedan and premium mid-sized SUV), while Volkswagen rebounded as its supply pipeline out of Europe improves.
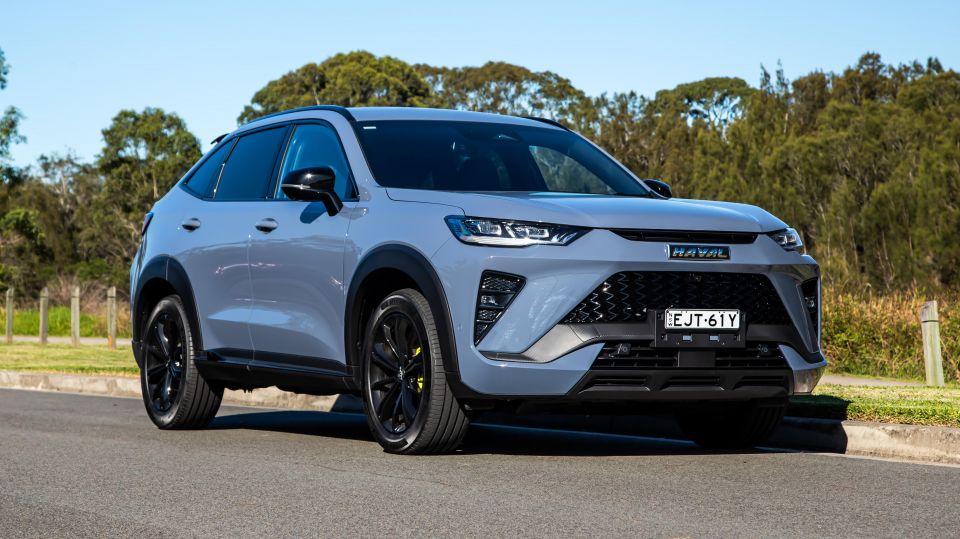
Subaru rounded out the top 10, just ahead of Isuzu Ute, GWM (including Haval and Tank brands too) and Nissan. Mercedes-Benz edged BMW, with or without van sales included, to top the traditional luxury market.
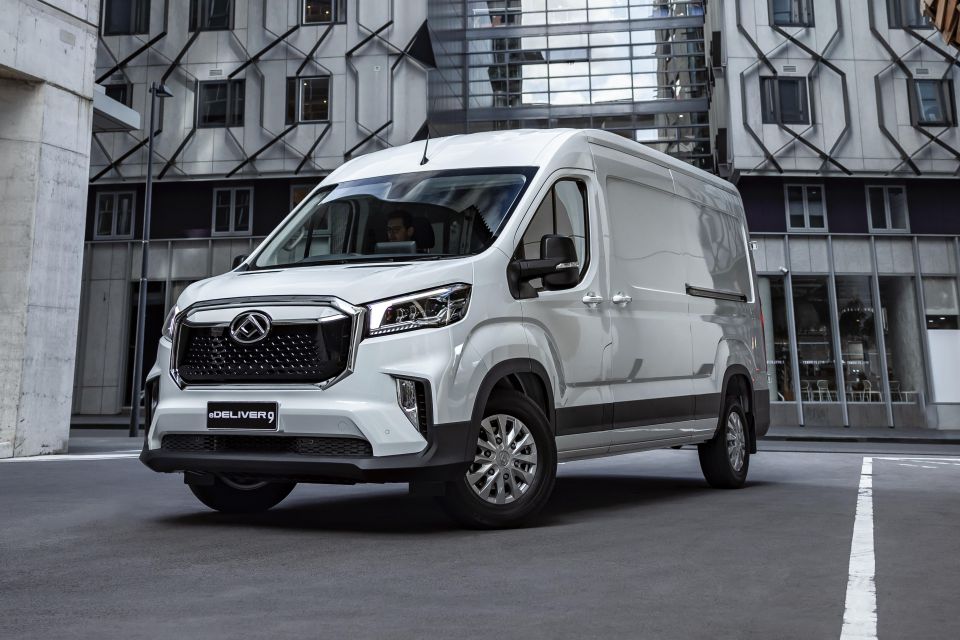
Brands that had stellar months beyond those listed included LDV (up 53 per cent), Lexus (up 164 per cent), Audi (up 72.5 per cent), Land Rover (up 169 per cent), Ram (up 50 per cent), SsangYong (up 147 per cent), Fiat (up 328 per cent), and Genesis (up 121 per cent).
Some brands that struggled and went backwards beyond the top 10 included Suzuki (down 24 per cent), Honda (down 43 per cent), and Jeep (down 27 per cent).
| BRAND | MAY SALES | YoY CHANGE |
|---|---|---|
| Toyota | 18,340 | -19.6% |
| Mazda | 8475 | 30.9% |
| Hyundai | 7078 | 0.2% |
| Kia | 7000 | -4.2% |
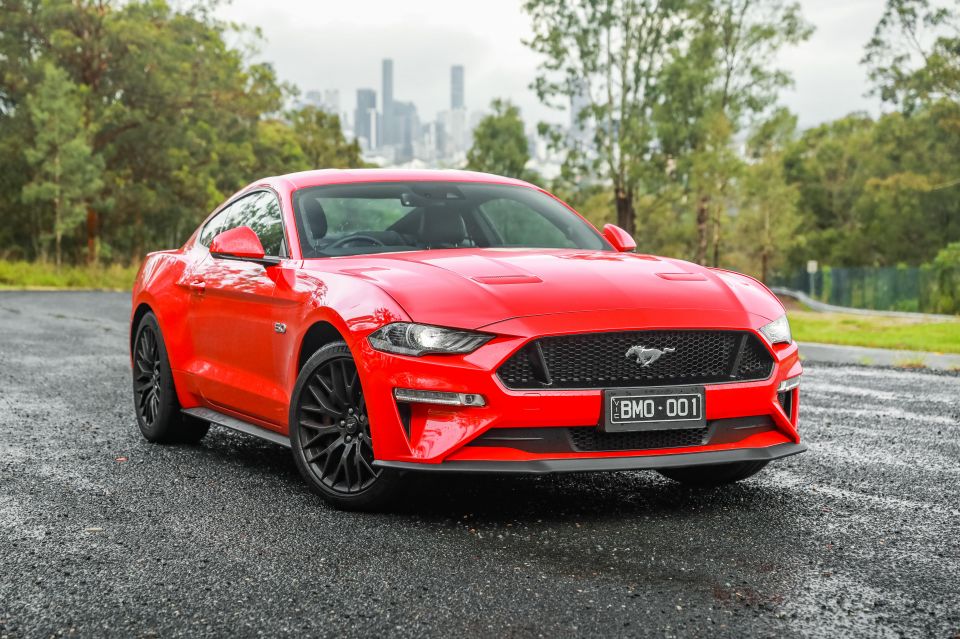
| Ford | 6251 | 19.5% |
| MG | 4828 | 18.8% |
| Mitsubishi | 4583 | -24.7% |
| Tesla | 4476 | >999% |
| Volkswagen | 3940 | 77.8% |
| Subaru | 3564 | -1.7% |
| Isuzu Ute | 3481 | -0.4% |
| GWM | 3241 | 72.6% |
| Nissan | 3085 | 3.9% |
| Mercedes-Benz | 2894 | 8.7% |
| BMW | 2329 | -8.1% |
| LDV | 2024 | 53.1% |
| Lexus | 1794 | 163.8% |
| Suzuki | 1696 | -23.6% |
| Audi | 1623 | 72.5% |
| BYD | 1448 | NA |
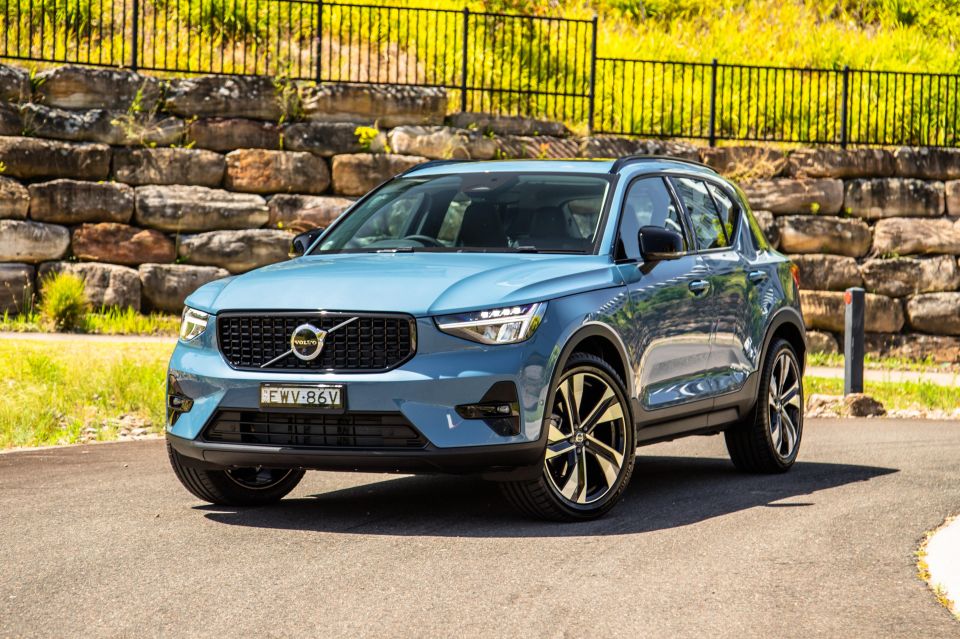
| Volvo Car | 1205 | 7.5% |
| Land Rover | 1101 | 169.2% |
| Renault | 825 | -1.4% |
| Honda | 814 | -42.8% |
| Ram | 766 | 50.2% |
| Skoda | 691 | 30.9% |
| Porsche | 685 | 43.9% |
| SsangYong | 609 | 146.6% |
| Chery | 584 | NA |
| Jeep | 448 | -27.2% |
| Mini | 399 | -8.5% |
| Chevrolet | 347 | 48.9% |
| Cupra | 260 | NA |
| Peugeot | 241 | 26.2% |
| Polestar | 226 | 47.7% |
| Fiat | 201 | 328.0% |
| Genesis | 188 | 121.2% |
| Maserati | 83 | 80.4% |
| Alfa Romeo | 57 | 32.6% |
| Jaguar | 46 | -35.2% |
| Bentley | 38 | 81.0% |
| Citroen | 26 | -33.3% |
| Ferrari | 25 | 78.6% |
| Lamborghini | 20 | NA |
| McLaren | 16 | 100.0% |
| Lotus | 10 | 400.0% |
| Aston Martin | 9 | -18.2% |
| Rolls-Royce | 6 | 50.0% |
The top 20 models list comprised 10 SUVs, six light commercial vehicles, and four passenger cars.
Sales by region
Category breakdown
Top segments by market share
Sales by buyer type
Sales by propulsion or fuel type
Sales by country of origin
Got any questions about car sales? Ask away in the comments and we’ll jump in!
Matt Campbell
5 Days Ago

Angus MacKenzie
4 Days Ago
Matt Campbell
3 Days Ago

James Wong
2 Days Ago

William Stopford
23 Hours Ago
William Stopford
17 Hours Ago