

Damion Smy
Suzuki Fronx recalled after seatbelt failure sparks ‘urgent investigation’
7 Hours Ago
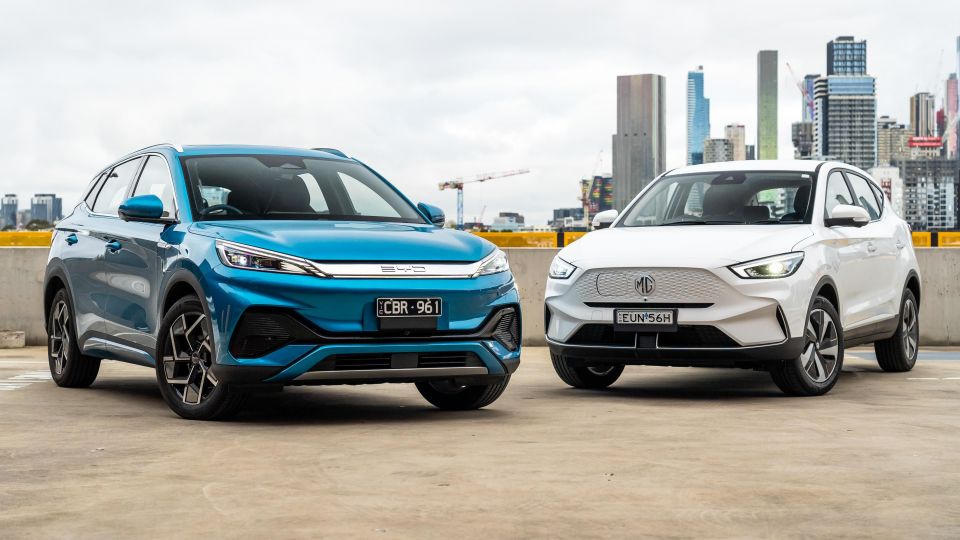
Tesla, BYD and MG led the way as electric car sales grew 160 per cent in 2023, with four-in-five EVs sourced from one country: China.

Senior Contributor

Senior Contributor
Australians took delivery of a record 87,430 electric vehicles (EVs) in 2023, equal to roughly 7.0 per cent total market share and up on volume by 160 per cent over 2022.
There are now 27 different brands selling at least one EV, with 61 models between them.
Of the total EV sales, 65.8 per cent were SUVs, 33.7 per cent were traditional passenger vehicles, and the remaining 0.5 per cent were a smattering of light- and heavy commercial vehicles.
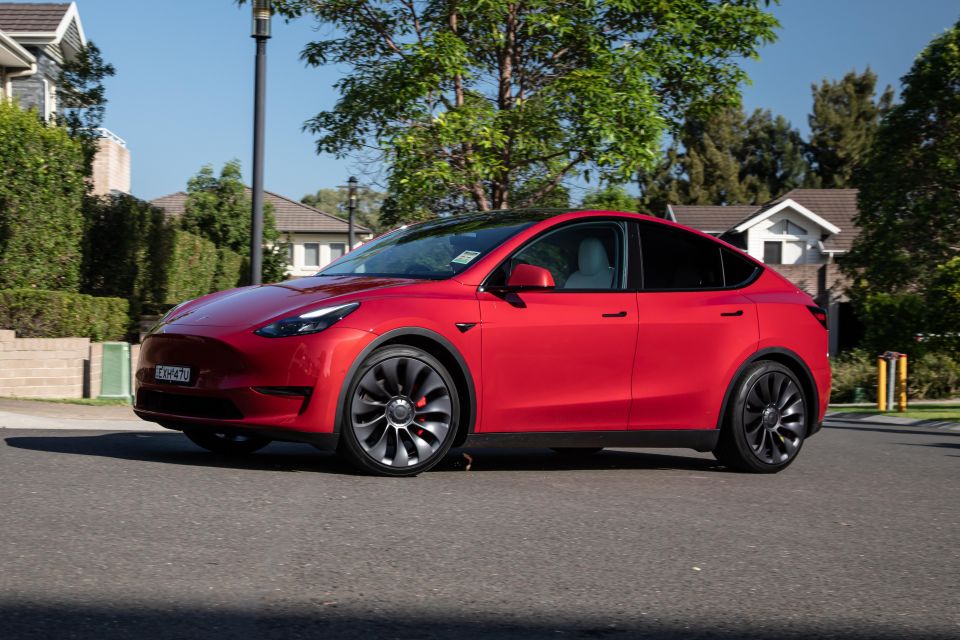
Top of the pops is Tesla with 46,116 sales from two models, equal to almost 53 per cent sector share, ahead of BYD with 12,438 sales from three models. These two OEMs combined accounted for precisely two-thirds of the total EV market.
Next in order were MG with 5928 EV sales from its two models, ahead of Volvo (3949 sales from two models) and Mercedes-Benz (3188 sales, with a market-highest 10 individual models).
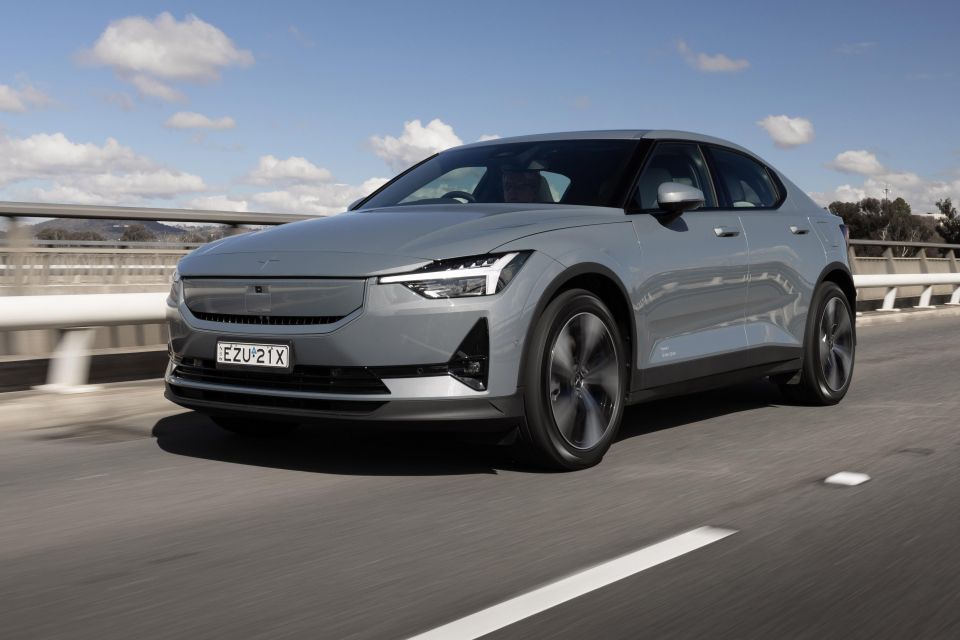
Rounding out the top 10 were Kia (3039 sales from three models), BMW (2990 sales from six models), Polestar (2463 sales from its sole model), Hyundai (2417 sales from four models), and Cupra (887 sales from one model).
EV sales for 2023 by brand:
| Brand | Sales |
|---|---|
| Tesla | 46,116 |
| BYD | 12,438 |
| MG | 5928 |
| Volvo | 3949 |
| Mercedes-Benz | 3188 |
| Kia | 3039 |
| BMW | 2990 |
| Polestar | 2463 |
| Hyundai | 2417 |
| Cupra | 887 |
| Mini | 551 |
| Audi | 539 |
| Porsche | 535 |
| GWM | 526 |
| Nissan | 484 |
| Lexus | 378 |
| Genesis | 280 |
| Fiat | 174 |
| LDV | 139 |
| Peugeot | 128 |
| Ford | 112 |
| Foton Mobility | 71 |
| Jaguar | 35 |
| SEA Electric | 26 |
| Renault | 21 |
| Mazda | 13 |
| Rolls-Royce | 3 |
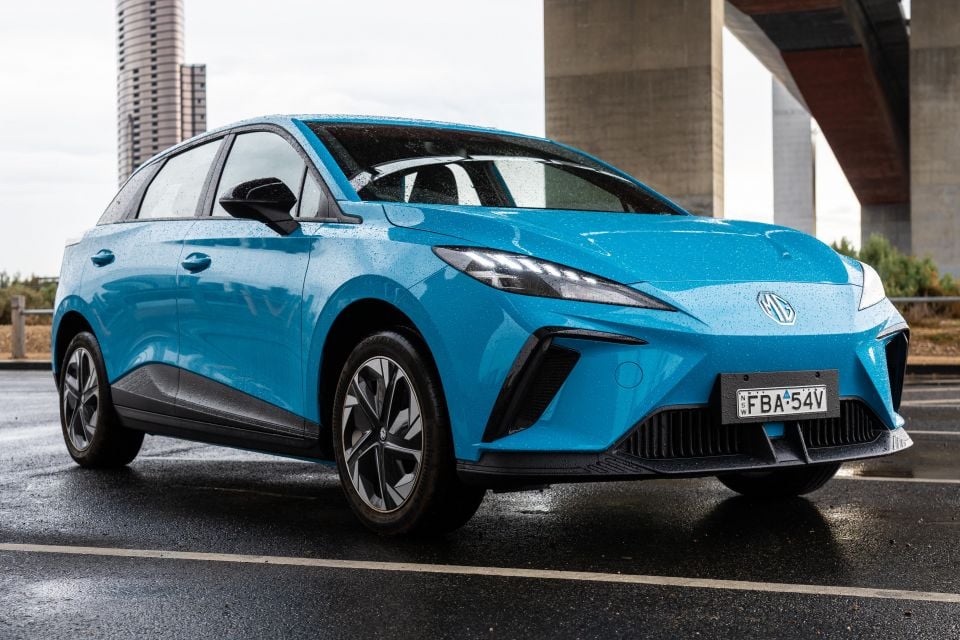
The five top-selling models were the Tesla Model Y (28,769, making it the market’s third top-selling SUV of any type), Tesla Model 3 (17,347), BYD Atto 3 (11,042), MG 4 (3134 after just a few months on sale), and Volvo XC40 Recharge (2846).
Rounding out the top 10 were the MG ZS EV (2794, just under 10 per cent of all ZS sales), Polestar 2 (2463 sales), Kia EV6 (1831 sales), Mercedes-Benz EQA (1196), and Volvo C40 Recharge (1103).
Fascinatingly, eight of the top 10 models are all made in China for the Australian market, and all of the top six were. In fact, China produced 72,402 EVs sold in Australia last year, equal to more than 80 per cent of the total!
EV sales for 2023 by model:
| Brand | Model | Sales |
|---|---|---|
| Tesla | Model Y | 28,769 |
| Tesla | Model 3 | 17,347 |
| BYD | Atto 3 | 11,042 |
| MG | 4 | 3134 |
| Volvo | XC40 Recharge | 2846 |
| MG | ZS | 2794 |
| Polestar | 2 | 2463 |
| Kia | EV6 | 1831 |
| Mercedes-Benz | EQA | 1196 |
| Volvo | C40 Recharge | 1103 |
| Kia | Niro | 1000 |
| Hyundai | Ioniq 5 | 947 |
| BMW | iX1 | 936 |
| BYD | Dolphin | 925 |
| Cupra | Born | 887 |
| Hyundai | Kona | 836 |
| BMW | iX | 822 |
| Mercedes-Benz | EQB | 783 |
| BMW | iX3 | 772 |
| Hyundai | Ioniq 6 | 623 |
| Mini | Hatch | 551 |
| Porsche | Taycan | 535 |
| GWM | Ora | 526 |
| Nissan | Leaf | 484 |
| BYD | Seal | 471 |
| Mercedes-Benz | EQE sedan | 437 |
| BMW | i4 | 353 |
| Audi | e-tron GT | 339 |
| Mercedes-Benz | EQC | 323 |
| Lexus | RZ 450e | 265 |
| Mercedes-Benz | EQS SUV | 252 |
| Kia | EV9 | 208 |
| Audi | e-tron | 200 |
| Genesis | GV60 | 191 |
| Fiat | 500e | 174 |
| Lexus | UX 300e | 113 |
| LDV | eT60 | 79 |
| Genesis | GV70 | 78 |
| Foton Mobility | T5 | 71 |
| Peugeot | e-Partner | 71 |
| Mercedes-Benz | EQS | 67 |
| BMW | i7 | 63 |
| Ford | E-Transit | 61 |
| Mercedes-Benz | EQS SUV | 60 |
| Peugeot | e-2008 | 57 |
| Ford | Mustang Mach-E | 51 |
| BMW | i5 | 44 |
| LDV | eDeliver 9 | 44 |
| Mercedes-Benz | eVito van | 40 |
| Jaguar | I-Pace | 35 |
| SEA Electric | HD and MD | 26 |
| Mercedes-Benz | eVito Tourer | 19 |
| Renault | Kangoo | 18 |
| Mazda | MX-30 | 13 |
| LDV | MIFA 9 | 12 |
| Genesis | G80 | 11 |
| Hyundai | Mighty | 11 |
| Mercedes-Benz | EQV | 11 |
| LDV | eDeliver 7 | 4 |
| Renault | Megane E-Tech | 3 |
| Rolls-Royce | Spectre | 3 |
Can you spot the outlier here? The EV market share in the four largest regional markets of New South Wales, Victoria, Queensland and Western Australia sits between 6.7 and 7.7 per cent, with Tasmania (6.5 per cent) and even South Australia (5.5 per cent) also in the ballpark.
It’s the two Territories that are the outliers: The Australian Capital Territory enjoys outsized EV share of 18.3 per cent thanks to the proliferation of government agencies, and the Northern Territory’s EV share languishes at 2.7 per cent – must be all those wide open spaces.
| Region | EV sales | Overall sales | EV share |
|---|---|---|---|
| NSW | 28,954 | 374,432 | 7.7% |
| VIC | 22,155 | 327,229 | 6.8% |
| QLD | 18,569 | 261,532 | 7.1% |
| WA | 8352 | 124,630 | 6.7% |
| SA | 4345 | 79,009 | 5.5% |
| ACT | 3399 | 18,531 | 18.3% |
| TAS | 1374 | 21,150 | 6.5% |
| NT | 282 | 10,267 | 2.7% |
Sales by propulsion or fuel type:
Got any questions about car sales? Ask away in the comments and we’ll jump in!


Damion Smy
7 Hours Ago

Damion Smy
8 Hours Ago

Damion Smy
9 Hours Ago

Damion Smy
12 Hours Ago

CarExpert.com.au
13 Hours Ago


Ben Zachariah
15 Hours Ago