
Derek Fung
Hyundai design executive is sick of light bars
2 Hours Ago
Nearly 125,000 new cars were sold in June 2023, up 25 per cent. Many brands say it could have been an even bigger month, but for one thing...

Senior Contributor

Senior Contributor
Australian new vehicle sales totalled 124,926 units in June 2023 – the best result since 2018 when 130,300 cars were sold – to wrap the financial year up in style.
This figure represents 25 per cent growth against June 2022, equates to 8.0 per cent growth for the first half of 2023 over the first half of 2022.
However it could have been an all-time record if vehicle supply matched demand, according to the peak body for Australia’s car brands.
“The end of the financial year has traditionally been a strong month for vehicle sales,” said Federal Chamber of Automotive chief executive Tony Weber.
“Indications from our members are that demand for new vehicles remains solid, but the supply is not yet at a point to meet this demand. To put it simply, if we could have landed more vehicles, this would have been a record June result,” he claimed.
“We will monitor the broader economic conditions and their potential to impact on vehicle purchasing decisions by fleets, businesses and families during the second half of this year.”
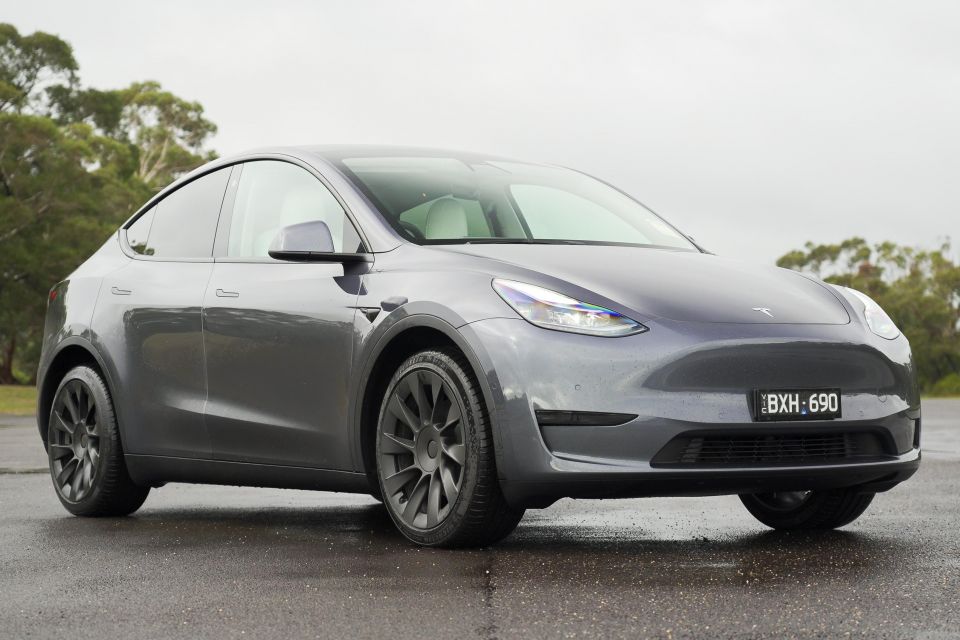
Battery electric vehicles accounted for 8.8 per cent of June sales, driven by a spectacular result from the Tesla Model Y which was the second top-selling vehicle outright, behind only the Toyota HiLux. EVs made up an even bigger 12 per cent of passenger/SUV sales.
EVs also made up a record 7.4 per cent of new vehicle sales during the first half 2023, with 43,092 sales representing 345 per cent growth YoY. Sales of all electrified vehicles continued to grow as well, with 16.6 per cent of all deliveries being EV, hybrid or plug-in hybrid.
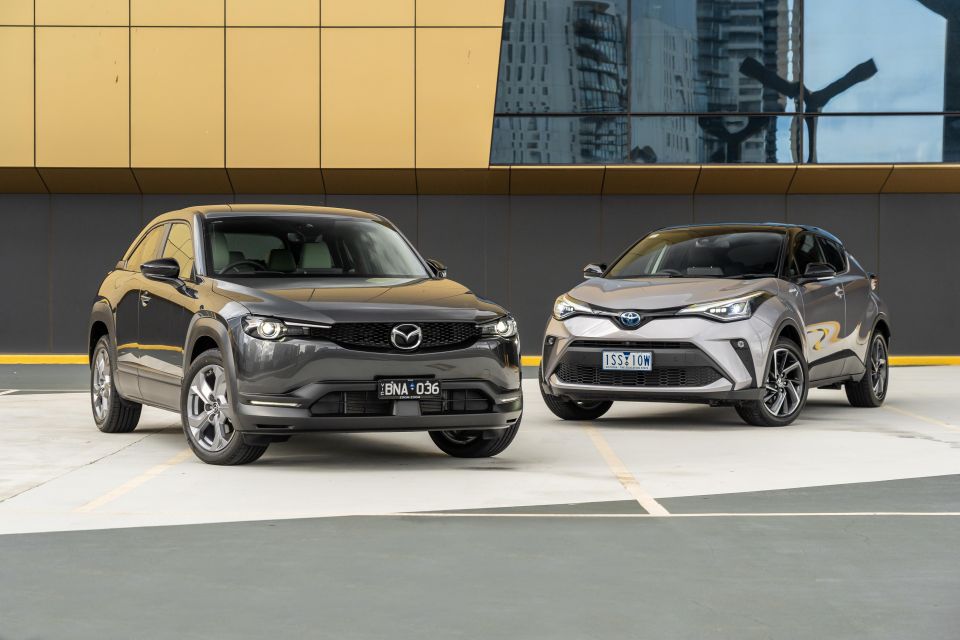
Toyota topped the tables as always but its market share of 16.8 per cent remains much lower than the 22.6 per cent it achieved in June 2022. It still has its share of supply problems leading to ongoing wait times, particularly on its in-demand hybrids.
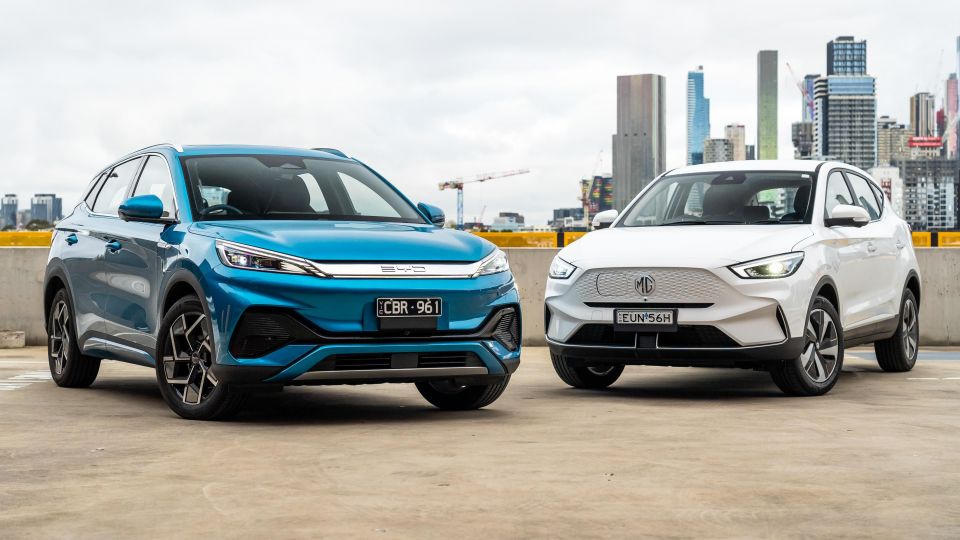
Mazda finished June in second on the back of very strong growth (55 per cent), edging out Hyundai, Ford and Kia. Tesla ended up an impressive sixth in June, ahead of MG, Mitsubishi, Volkswagen and Subaru.
Positions 11-20 were occupied in running order by GWM (including Haval), Isuzu Ute, BMW (the top luxury brand if you take out Tesla), Mercedes-Benz, LDV, Nissan, Audi, Suzuki, BYD and Lexus. That means four of the top 20 brands were Chinese.
Some smaller-volume OEMs that recorded above-average monthly sales growth included Ram (up 85 per cent), SsangYong (up 144 per cent), Land Rover (up 84 per cent), Mini (up 82 per cent), Chevrolet (207.5 per cent), and Peugeot (up 94 per cent).
| BRAND | SALES | CHANGE OVER JUNE ’22 |
|---|---|---|
| Toyota | 20,948 | Down 7.1% |
| Mazda | 9706 | Up 55.4% |
| Hyundai | 8215 | Down 0.5% |
| Ford | 7753 | Up 55.9% |
| Kia | 7551 | Down 11.0% |
| Tesla | 7018 | Up >999% |
| MG | 6016 | Up 36.6% |
| Mitsubishi | 5187 | Down 11.3% |
| Volkswagen | 5125 | Up 71.2% |
| Subaru | 4920 | Up 37.6% |
| GWM | 3897 | Up 59.7% |
| Isuzu Ute | 3611 | Up 4.5% |
| BMW | 3038 | Up 30.6% |
| Mercedes-Benz | 3016 | Down 29.3% |
| LDV | 2760 | Up 167.2% |
| Nissan | 2759 | Up 44.7% |
| Audi | 1841 | Up 13.8% |
| Suzuki | 1655 | Down 34.7% |
| BYD | 1532 | – |
| Lexus | 1491 | Up 141.7% |
| Volvo | 1304 | Up 11.1% |
| Ram | 1172 | Up 85.2% |
| Honda | 1116 | Up 7.7% |
| Renault | 972 | Down 10.0% |
| Skoda | 810 | Up 17.1% |
| SsangYong | 751 | Up 143.8% |
| Land Rover | 742 | Up 83.7% |
| Porsche | 726 | Up 15.4% |
| Jeep | 655 | Down 0.6% |
| Chery | 603 | – |
| Mini | 587 | Up 81.7% |
| Chevrolet | 452 | Up 207.5% |
| Cupra | 359 | – |
| Peugeot | 336 | Up 94.2% |
| Polestar | 251 | Up 24.9% |
| Genesis | 238 | Up 98.3% |
| Fiat | 161 | Up 98.8% |
| Maserati | 105 | Up 32.9% |
| Alfa Romeo | 86 | Up 45.8% |
| Jaguar | 47 | Down 33.8% |
| Aston Martin | 27 | Up 42.1% |
| Lamborghini | 22 | Up 83.3% |
| Citroen | 19 | Up 35.7% |
| Bentley | 15 | Down 37.5% |
| Ferrari | 14 | Down 30.0% |
| Lotus | 14 | Up 600.0% |
| McLaren | 10 | Up 42.9% |
| Rolls-Royce | 5 | Down 37.5% |
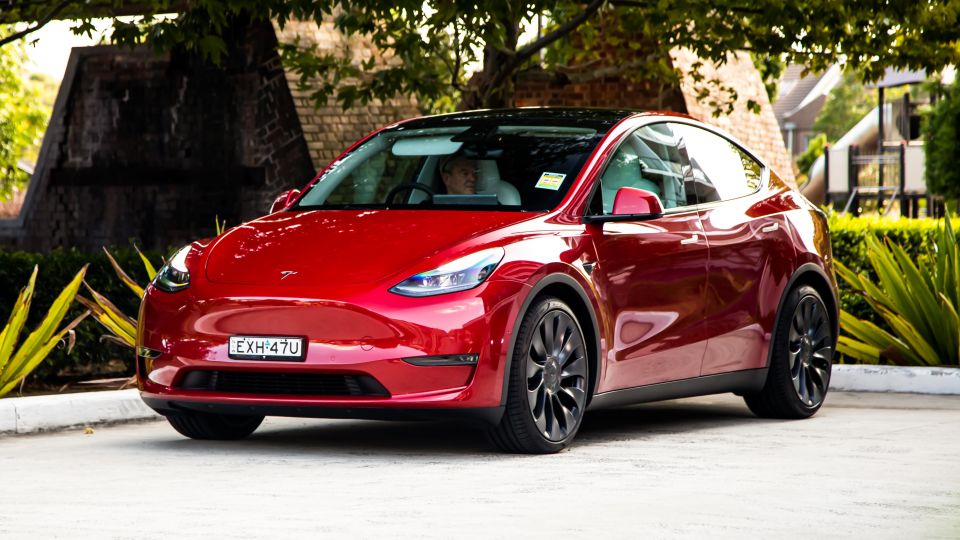
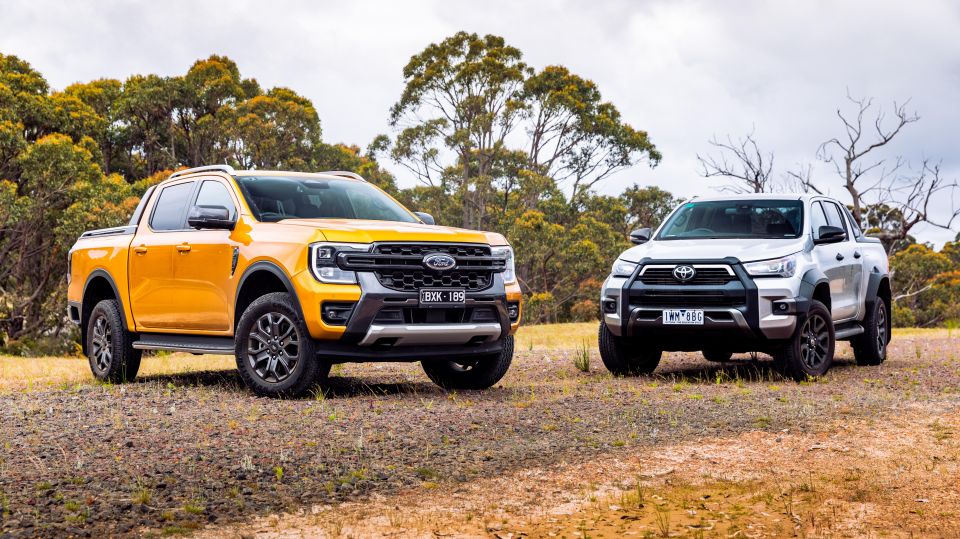
The Toyota HiLux was top of the pops, but its Ford Ranger adversary was relegated to third place by the Tesla Model Y – which finished second before the recent price cuts were announced.
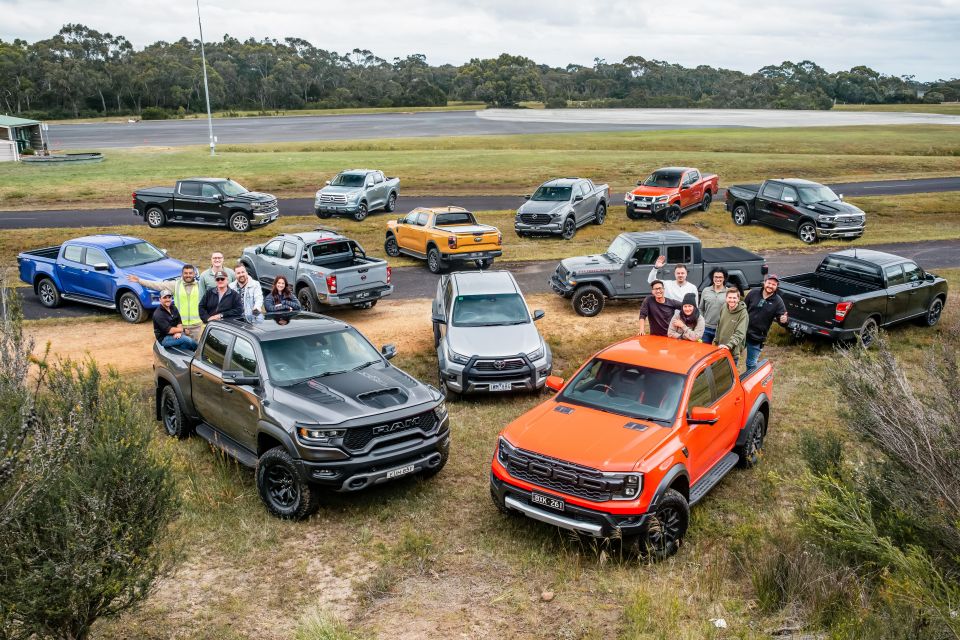
Rounding out the top 10 were the MG ZS, Toyota RAV4, Hyundai Tucson, Mazda BT-50, Hyundai i30, Isuzu D-Max and Mitsubishi Triton. Half of the top 10 were utes, you’ll note, coinciding with the demise of the instant asset tax write-off.
The top 25 list below comprises six utes and eight mid-sized SUVs, reflecting their ongoing dominance on a segment basis. This top 25 also comprised six Toyotas.
Sales by region
Category breakdown
Top segments by market share
Sales by buyer type
Sales by propulsion or fuel type
Sales by country of origin
Got any questions about car sales? Ask away in the comments and we’ll jump in!


Derek Fung
2 Hours Ago

Paul Maric
8 Hours Ago

James Wong
15 Hours Ago

James Wong
15 Hours Ago


CarExpert.com.au
17 Hours Ago

Damion Smy
17 Hours Ago