Sales of new cars in Australia climbed 11.1 per cent in January 2021 over the same month last year, to 79,666 units.
According to today’s VFACTS data, submitted by car brands and published by the Federal Chamber of Automotive Industries (FCAI), sales in each State and Territory were up on last year’s tally by between 1.9 and 38.7 per cent.
This sales jump came entirely from the private-buyer market, which was up 25.4 per cent to 43,402 sales. Business fleet sales fell 1.3 per cent (28,591), rental car sales fell to 3120 (down 12.4 per cent), and government fleet sales declined 11.2 per cent (2146).
This jump is even more noticeable when you factor in the stock shortages that many brands and their dealers are reporting – partially a result of supply chain lags due to overseas COVID-19 situations.
Clearly the latent demand built up during a restricted 2020 trading period is too strong…
SUVs accounted for a dominant 52.1 per cent market share. Passenger vehicles (sedans, hatchbacks, coupes, convertibles and people-movers) owned 23.3 per cent share, and light commercial utes and vans a further 21.9 per cent.
Toyota was the market-leading brand with more than 20 per cent overall market share, while MG was the fastest-growing and almost hit the top 10.
Brands
Toyota’s 16,819 sales tally was up 13.6 per cent. Mazda in second grew its volume over January 2020 by 27 per cent thanks to strong months for BT-50 4×4, CX-30 and CX-8.
Hyundai in third was up 9.3 per cent thanks to improvement from the Venue and Kona, and the new Palisade.
Kia nabbed fourth spot thanks to 16.9 per cent monthly growth driven by great months from its Picanto and (supply-restricted) Sorento range bookends. Mitsubishi in fifth was only up 1.4 per cent, meaning its market share dipped.
Rounding out the top 10 were Ford, Nissan, Subaru (up an impressive 43.2 per cent thanks to strong months from the XV, Forester and Outback), Volkswagen (down 16.1 per cent as stock of the outgoing Golf 7.5 ran dry), and combined Mercedes-Benz cars and commercials.
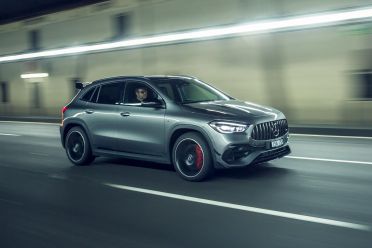
Even if you separate Mercedes-Benz Cars (2443) and Mercedes-Benz Vans (232) the German brand would’ve had a presence in them top 10, ahead of BMW (14th) and Audi (16th).
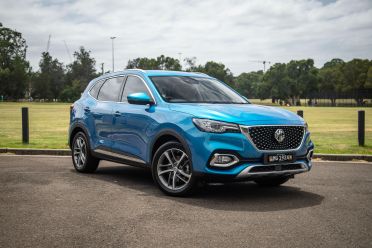
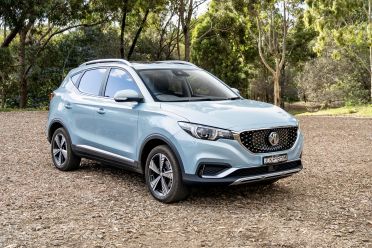
The biggest-growing marque was MG, which finished a remarkable 11th overall on 2408 sales, up 162 per cent. These are new heights for a Chinese car brand in Australia.
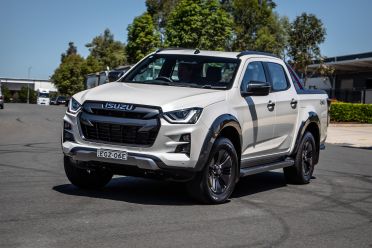
The other most impressive performer was Isuzu Ute Australia on 2363 monthly sales, up 111 per cent. Given it only sells two models – the D-Max ute and MU-X 4×4 wagon – such a haul is impressive.
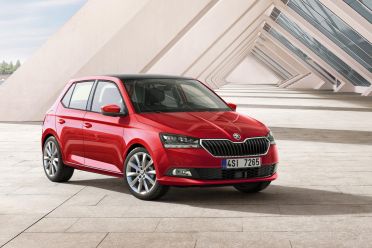
Smaller-volume brands that grew their sales by more than the market average included Suzuki (up 30.4 per cent), Skoda (up 66.9 per cent into 17th place), Volvo (up 45.2 per cent), LDV (up 100.5 per cent), Jeep (up 30.5 per cent), and SsangYong (up 139.7 per cent).
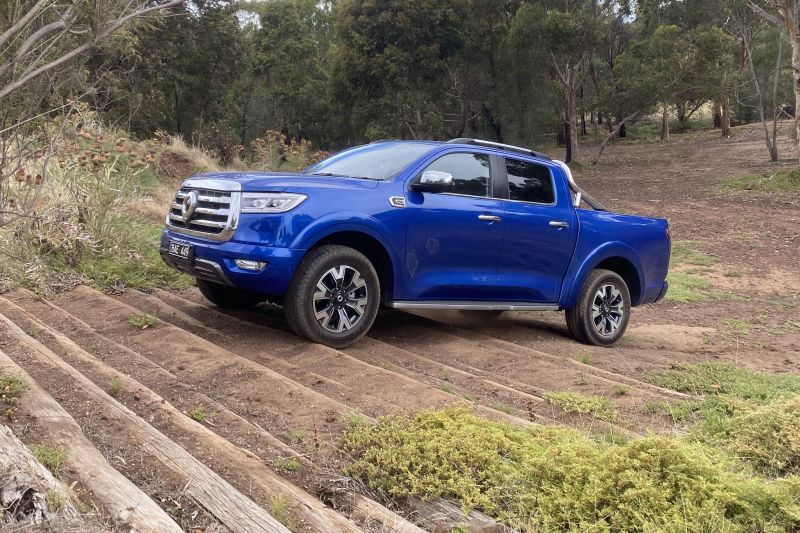
One new entrant in the figures is GWM, which represents the now-combined tallies of GWM Ute (formerly Great Wall) and Haval. This Chinese player finished 20th overall with 769 sales, up 135.9 per cent.
Brands that went backwards in sales over January 2020 included Honda (down 33.4 per cent), BMW (down 11.9 per cent), Land Rover (down 13.4 per cent), Renault (down 38.6 per cent), Peugeot (down 21.9 per cent), Jaguar (down 58.9 per cent), and Alfa Romeo (down 41.5 per cent).
| Brand | Jan 2021 sales | Change |
|---|---|---|
| Toyota | 16,819 | 13.6% |
| Mazda | 8508 | 27.1% |
| Hyundai | 5951 | 9.3% |
| Kia | 5500 | 16.9% |
| Mitsubishi | 5179 | 1.4% |
| Ford | 5099 | 22.3% |
| Nissan | 3756 | 9.1% |
| Subaru | 3223 | 43.2% |
| Volkswagen | 2722 | -16.1% |
| Mercedes-Benz | 2675 | 20.8% |
| MG | 2408 | 162% |
| Isuzu Ute | 2363 | 111.0% |
| Honda | 2290 | -33.4% |
| BMW | 1701 | -11.9% |
| Suzuki | 1613 | 30.4% |
| Audi | 1455 | 0.5% |
| Skoda | 901 | 66.9% |
| Volvo | 803 | 45.2% |
| LDV | 770 | 100.5% |
| GWM (Great Wall Haval) | 769 | 135.9% |
| Lexus | 745 | 3.0% |
| Land Rover | 536 | -13.4% |
| Jeep | 505 | 30.5% |
| Porsche | 402 | -2.0% |
| Renault | 258 | -38.6% |
| Mini | 241 | -9.4% |
| SsangYong | 175 | 139.7% |
| Ram | 119 | -8.5% |
| Peugeot | 107 | -21.9% |
| Fiat | 119 | 0.8% |
| Chevrolet | 64 | – |
| Jaguar | 53 | -58.9% |
| Alfa Romeo | 38 | -41.5% |
| Maserati | 36 | 33.3% |
| Chrysler | 29 | 3.6% |
| Bentley | 17 | 13.3% |
| Citroen | 17 | 30.8% |
| Ferrari | 16 | -42.9% |
| Aston Martin | 15 | 87.5% |
| Genesis | 15 | 50.0% |
| Lamborghini | 12 | 71.4% |
| Rolls-Royce | 7 | 250.0% |
| McLaren | 5 | 25.0% |
| Alpine | 1 | 0.0% |
Models
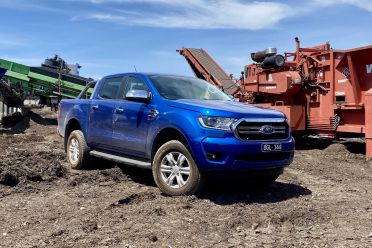
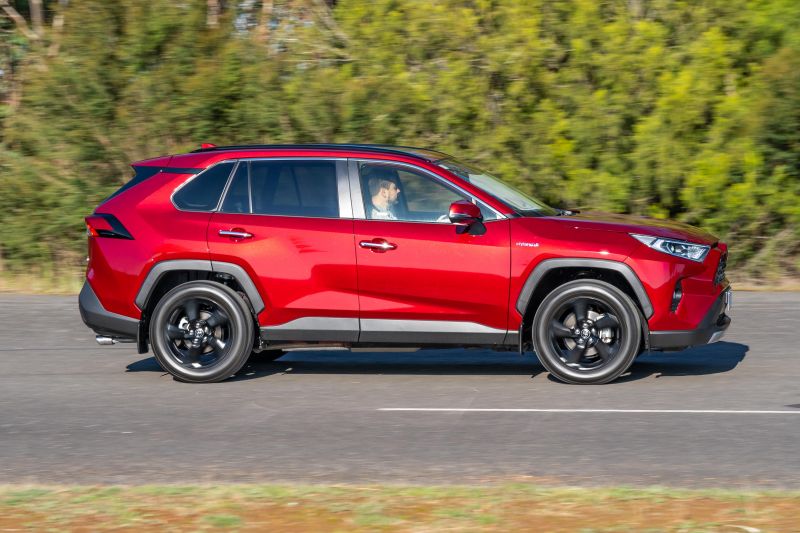
The usual suspects of Toyota HiLux, Ford Ranger and Toyota RAV4 were once again the top-three selling models.
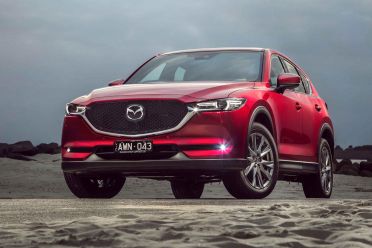
Rounding out the top five were the Mazda CX-5 and Toyota Corolla, the latter meaning Toyota had the most popular car, SUV and light commercial models.
Within the top 20 list below, there are five utes, 11 SUVs and four passenger cars.
| Model | Sales | Change |
|---|---|---|
| Toyota HiLux | 3913 | 31.8% |
| Ford Ranger | 3120 | 18.9% |
| Toyota RAV4 | 3066 | 33.9% |
| Mazda CX-5 | 2081 | 11.9% |
| Toyota Corolla | 2062 | -13.0% |
| Hyundai i30 | 1952 | -4.2% |
| Mitsubishi Triton | 1908 | -8.0% |
| Isuzu D-Max | 1822 | 167.9% |
| Nissan X-Trail | 1593 | 8.6% |
| Kia Cerato | 1545 | 3.0% |
| Mazda 3 | 1501 | 12.9% |
| Toyota LandCruiser Wagon | 1499 | 99.6% |
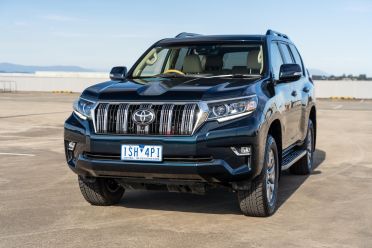
| Toyota Prado | 1359 | 10.5% |
| Mazda CX-3 | 1344 | 1.7% |
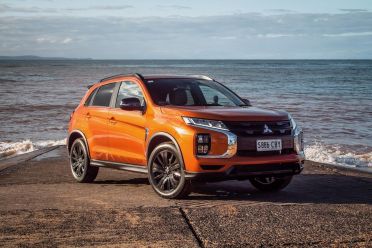
| Mitsubishi ASX | 1278 | 2.1% |
| MG ZS | 1253 | 327.6% |
| Subaru Forester | 1231 | 52.7% |
| Hyundai Tucson | 1206 | -4.1% |
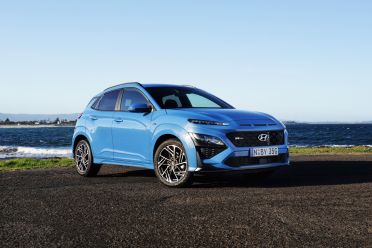
| Hyundai Kona | 1091 | 38.3% |
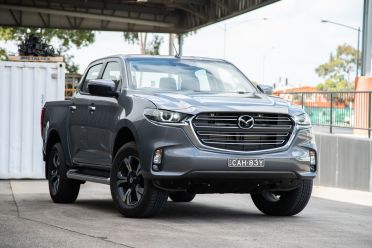
| Mazda BT-50 | 1044 | 75.5% |
We can also identify the most popular models in each vehicle segment, as defined by the FCAI in its VFACTS data.
- Micro Cars: Kia Picanto (573), Mitsubishi Mirage (56), Fiat 500 (49)
- Light Cars under $25,000: MG 3 (859), Suzuki Swift (562), Volkswagen Polo (526)
- Light Cars over $25,000: Mini (147), Audi A1 (68), Citroen C3 (8)
- Small Cars under $40,000: Toyota Corolla (2062), Hyundai i30 (1952), Kia Cerato (1545)
- Small Cars over $40,000: Mercedes-Benz A-Class (323), BMW 1 Series (223), Audi A3 (124)
- Medium Cars under $60,000: Toyota Camry (815), Subaru Liberty (183), Skoda Octavia (153)
- Medium Cars over $60,000: Mercedes-Benz C-Class (398), BMW 3 Series (139), Lexus IS (96)
- Large Cars under $70,000: Kia Stinger (147), Skoda Superb (48)
- Large Cars over $70,000: Mercedes-Benz E-Class (58), BMW 5 Series (32), Audi A6 (23)
- Upper Large Cars: Chrysler 300 (29), Lexus LS (7), Mercedes-Benz S-Class (6)
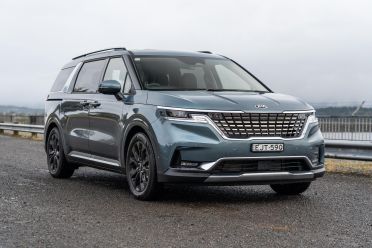
- People Movers: Kia Carnival (442), Honda Odyssey and Hyundai iMax (67), LDV G10 (61)
- Sports Cars under $80,000: Ford Mustang (361), Mazda MX-5 (53), Hyundai Veloster (45)
- Sports Cars over $80,000: Mercedes-Benz C-Class (73), BMW 4 Series (55), Mercedes-Benz E-Class (23)
- Sports Cars over $200,000: Porsche 911 (33), Ferrari range (16), Aston Martin two-door range (9)
- Light SUVs: Mazda CX-3 (1344), Toyota Yaris Cross (541), Volkswagen T-Cross (494)
- Small SUVs under $40,000: Mitsubishi ASX (1278), MG ZS (1253), Hyundai Kona (1091)
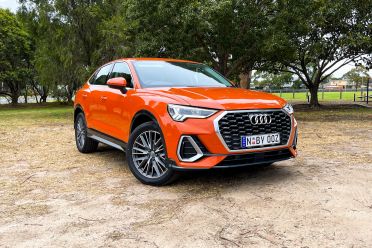
- Small SUVs over $40,000: Audi Q3 (385), Volvo XC40 (367), Mercedes-Benz GLA (365)
- Medium SUVs under $60,000: Toyota RAV4 (3066), Mazda CX-5 (2081), Nissan X-Trail (1593)
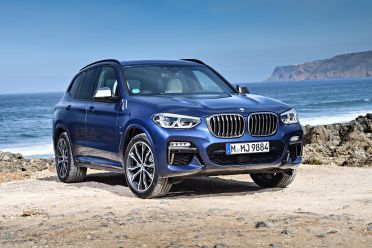
- Medium SUVs over $60,000: BMW X3 (358), Audi Q5 (305), Volvo XC60 (290)
- Large SUVs under $70,000: Toyota Prado (1359), Kia Sorento (745), Hyundai Santa Fe and Mazda CX-8 (571)
- Large SUVs over $70,000: BMW X5 (302), Mercedes-Benz GLE (262), Audi Q7 (177)
- Upper Large SUVs under $100,000: Toyota LandCruiser (1499), Nissan Patrol (241)
- Upper Large SUVs over $100,000: Mercedes-Benz G-Class (96), Mercedes-Benz GLS (44), BMW X7 (41)
- Light Vans: Volkswagen Caddy (121), Renault Kangoo (45), Peugeot Partner (8)
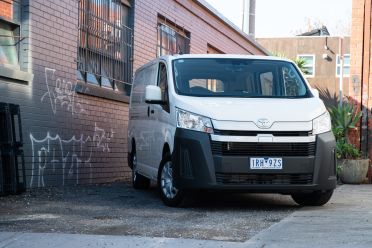
- Medium Vans: Toyota HiAce (705), Ford Transit Custom (303), Hyundai iLoad (294)
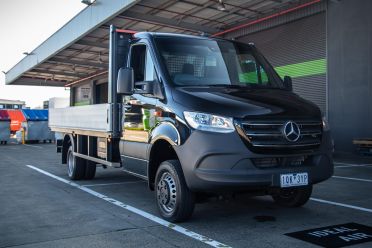
- Large Vans: Mercedes-Benz Sprinter (131), Ford Transit Heavy (89), LDV Deliver 9 (48)
- Light Buses: Toyota HiAce (179), Toyota Coaster (17), Mercedes-Benz Sprinter (3)
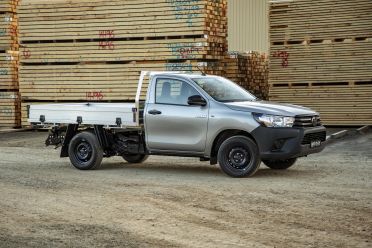
- 4×4 Utes: Toyota HiLux (823), Isuzu D-Max (406), Ford Ranger (318)
- 4×4 Utes: Toyota HiLux (3090), Ford Ranger (2802), Mitsubishi Triton (1723)
Miscellaneous
| State/Territory | Sales | Change |
|---|---|---|
| ACT | 1301 | 16.6% |
| NSW | 25,527 | 9.1% |
| NT | 709 | 38.7% |
| Qld | 16633 | 18.1% |
| SA | 5284 | 17.0% |
| Tas | 1272 | 6.6% |
| Vic | 20,722 | 1.9% |
| WA | 8218 | 24.9% |
The top five segments were Medium SUVs (18.7 per cent market share), 4×4 utes (16.7), Small SUVs (14.7), Small cars (11.6), and Large SUVs (11.6). That means 73.3 per cent of all vehicles sold came from one of these five segments.
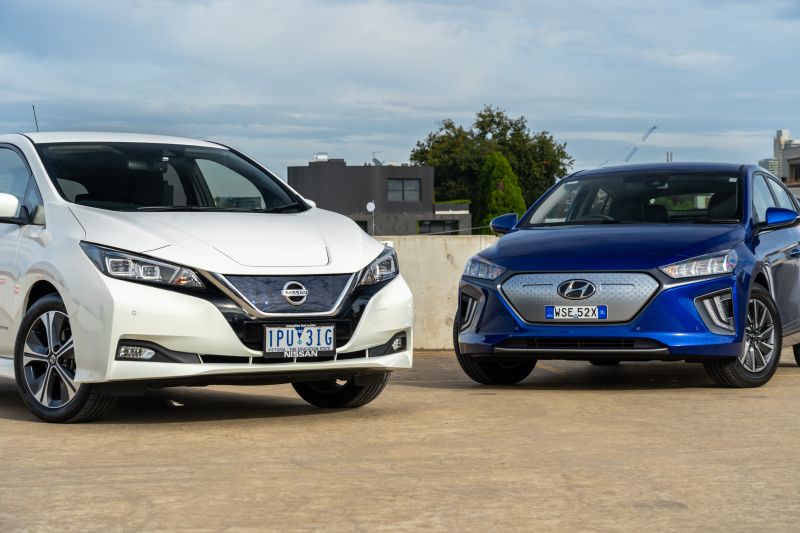
There were 47,356 petrol-powered vehicles sold (up 3.8 per cent), 24,662 diesels (up 19.1 per cent thanks to utes), 5247 hybrids (up 51.1 per cent over a record 2020 haul), 296 electric vehicles excluding Tesla (up 146.7 per cent), and 158 plug-in hybrids (up 79.5 per cent).
The main sources of vehicle imports were Japan (29,275), Thailand (16,903), Korea (11,516), China (4198, up 156.4 per cent), Germany (3078), and the USA (2056).
Quotes
FCAI chief executive, Tony Weber, said the January result was a very positive sign for the industry.
“During the past three months sales had increased by 12.4 per cent compared to the corresponding period twelve months earlier,” he said.
“The January sales numbers are indicative of positive consumer confidence in the domestic economy.
“With attractive interest rates and a range of other economic indicators encouraging consumption, we hope to see this trend in new vehicle purchasing continue through 2021.”
Previous monthly reports
- December 2020 Australian new vehicle sales (VFACTS)
- November 2020 Australian new vehicle sales (VFACTS)
- October 2020 Australian new vehicle sales (VFACTS)
- September 2020 Australian new vehicle sales (VFACTS)
- August 2020 Australian new vehicle sales (VFACTS)
- July 2020 Australian new vehicle sales (VFACTS)
- June 2020 Australian new vehicle sales (VFACTS)
- May 2020 Australian new vehicle sales (VFACTS)
- April 2020 Australian new vehicle sales (VFACTS)
- March 2020 Australian new vehicle sales (VFACTS)
Got any questions about car sales? Ask away in the comments and I’ll jump in!


