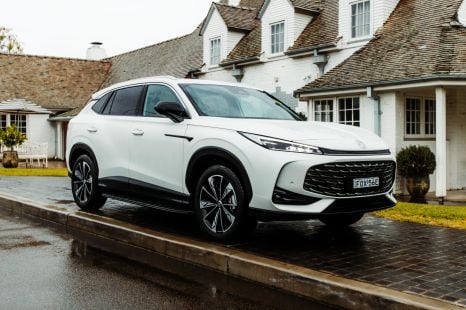
2023 finished on a high note, with new vehicle sales climbing 12.1 per cent in December 2023 over December 2022.
Sales were up in every state and territory, which helped make 2023 a record year for new vehicle sales in Australia.
Passenger vehicle sales were up by 8.7 per cent, SUV sales were up by 6.5 per cent, and light commercial vehicle sales were up by 31.2 per cent.
You can view our full-year 2023 VFACTS breakdown here.
Brands
Toyota naturally held onto the top spot, with 19,281 sales – accounting for 19.6 per cent of the total new vehicle market in Australia.
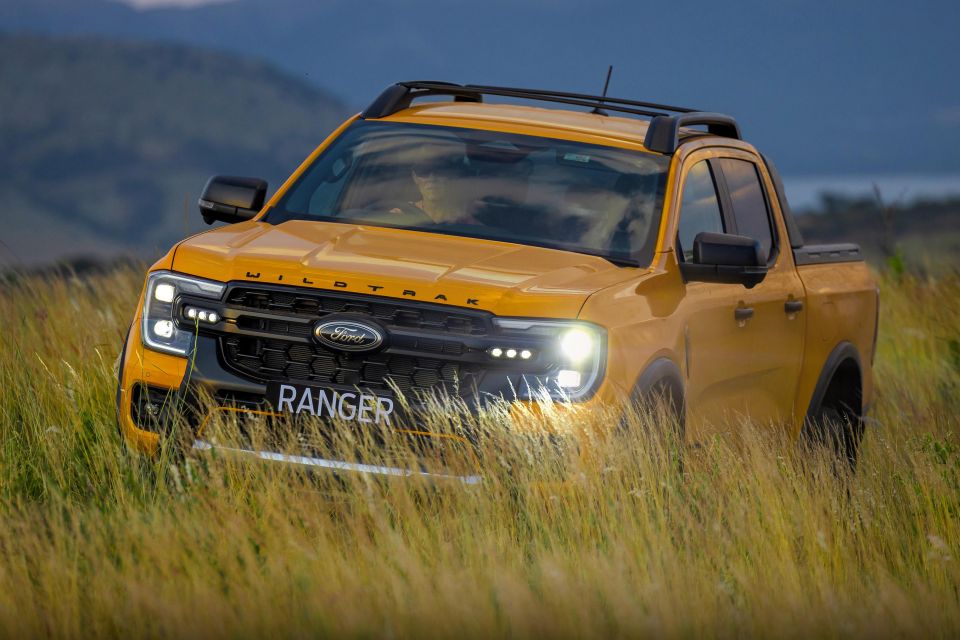
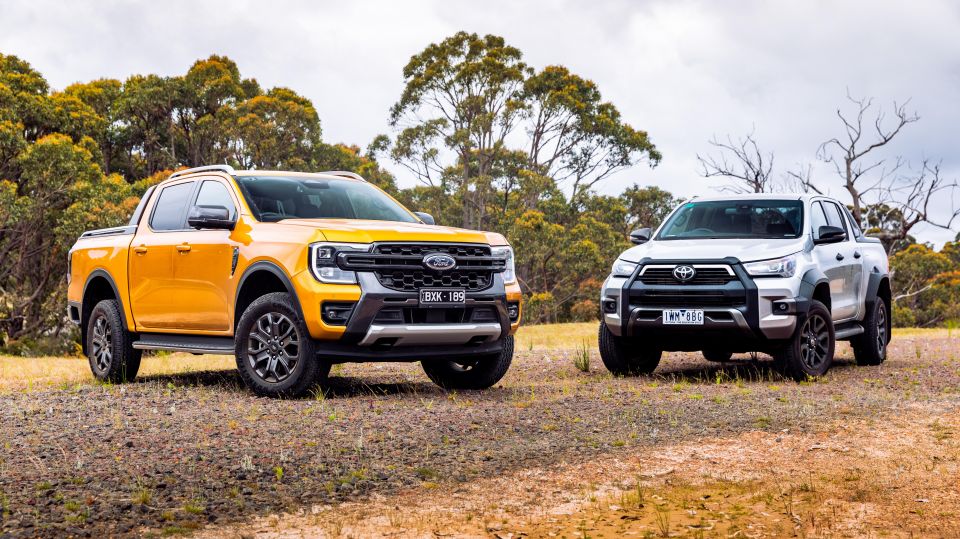
Ford pushed past Mazda thanks to strong sales of its Ranger and Everest, with 9826 sales – up 59.4 per cent over December 2022. It had an even 10 per cent of the overall market.
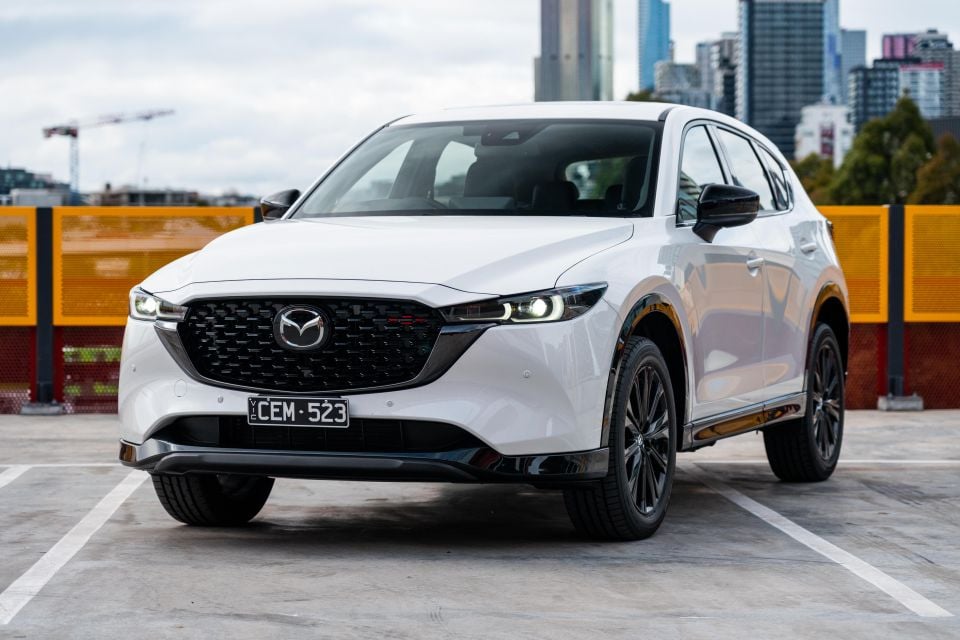
Mazda finished in second overall for 2023 but sat in third place for the month of December, with sales dipping 20.4 per cent compared with December 2022 for a total of 6765 units.
Hyundai was overtaken by Kia in December, which helped the latter become the best-selling Korean brand in 2023 despite selling an almost identical number of vehicles as the previous December.
Kia (in fifth place) and Hyundai (in seventh) bookended Mitsubishi in sixth, with 5134 sales for the Japanese brand – up 4.2 per cent on December 2022.
The top 10 was rounded out by Isuzu, GWM, MG and Subaru.
| Brand | Dec sales | % Change YoY |
|---|
| Toyota | 19,281 | 18.5% |
| Ford | 9826 | 59.4% |
| Mazda | 6765 | -20.4% |
| Kia | 5583 | -0.8% |
| Mitsubishi | 5134 | 4.2% |
| Hyundai | 4887 | 10.2% |
| Isuzu | 3987 | 59.2% |
| GWM | 3862 | 17.2% |
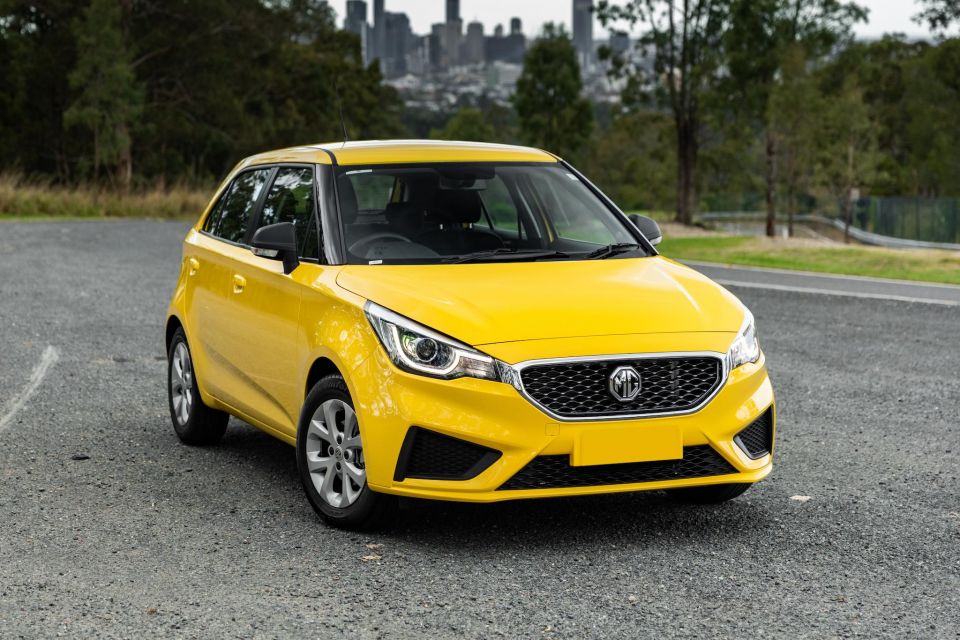
| MG | 3834 | -26.2% |
| Subaru | 3623 | -11% |
| Volkswagen | 3613 | 18.1% |
| Mercedes-Benz | 2267 | 9.94% |
| Nissan | 2658 | 4.6% |
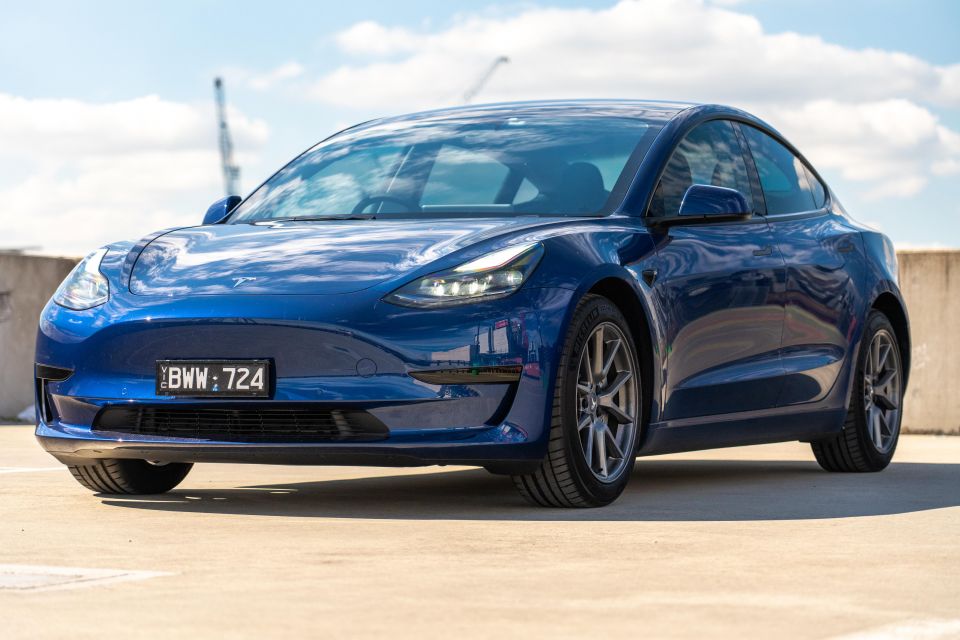
| Tesla | 2192 | -3.3% |
| BMW | 2005 | 106.5% |
| LDV | 1623 | 11.5% |
| Honda | 1577 | 58.3% |
| Audi | 1470 | 16.5% |
| BYD | 1463 | 15.4% |
| Suzuki | 1203 | -9.3% |
| Lexus | 1144 | 109.5% |
| Volvo | 927 | -5.4% |
| Chery | 730 | NEW |
| Land Rover | 649 | 258.6% |
| Skoda | 631 | 8.6% |
| SsangYong | 494 | -4.6% |
| Renault | 448 | -3.4% |
| Polestar | 405 | 56.4% |
| Chevrolet | 356 | -1.9% |
| Ram | 349 | -44.5% |
| Jeep | 325 | -24.1% |
| Porsche | 302 | -31.1% |
| Cupra | 282 | 43.1% |
| Mini | 279 | 149.1% |
| Peugeot | 217 | 39.1% |
| Fiat | 172 | 107.2% |
| Genesis | 113 | 59.2% |
| Jaguar | 77 | 999% |
| Alfa Romeo | 57 | 39% |
| Maserati | 37 | -9.8% |
| Bentley | 31 | 93.8% |
| Lamborghini | 23 | 283.3% |
| Aston Martin | 16 | 6.7% |
| Citroen | 14 | -54.8% |
| Ferrari | 13 | -23.5% |
| Lotus | 9 | N/A |
| Rolls-Royce | 5 | -28.6% |
| McLaren | 4 | -20% |
Models
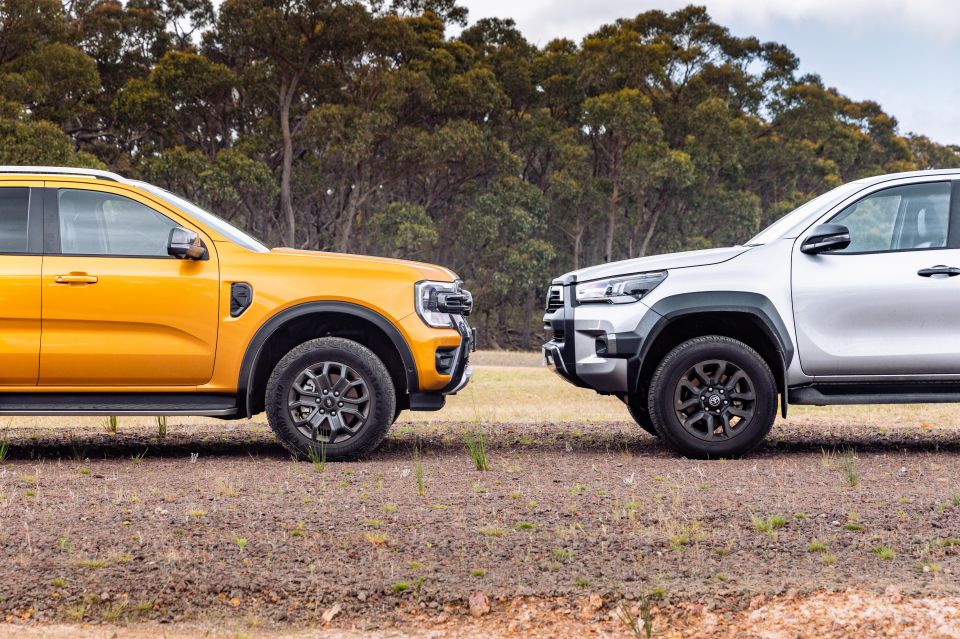
- Ford Ranger – 7767
- Toyota HiLux – 5143
- Isuzu D-Max – 2833
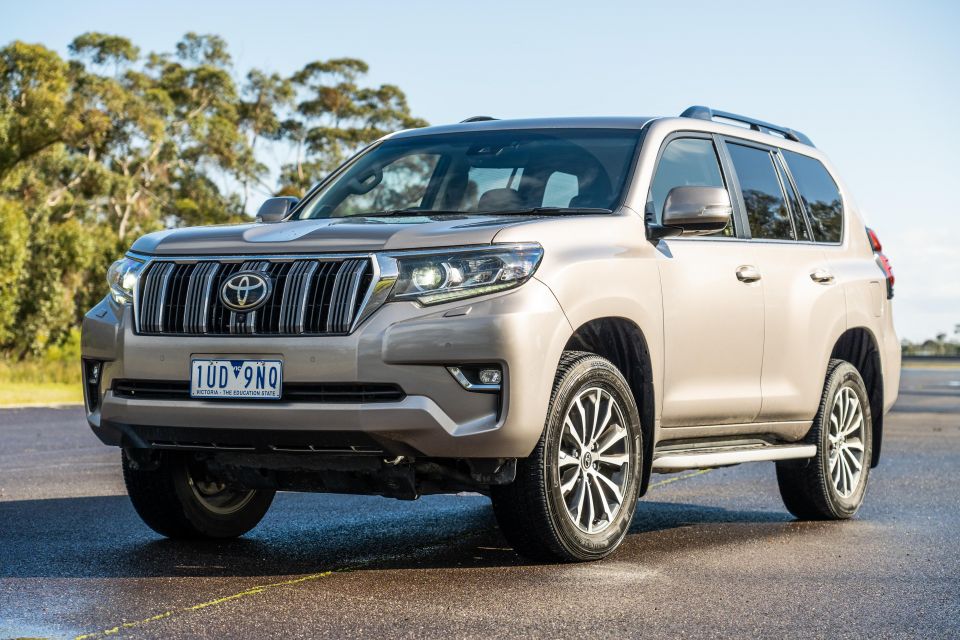
- Toyota Prado – 2475
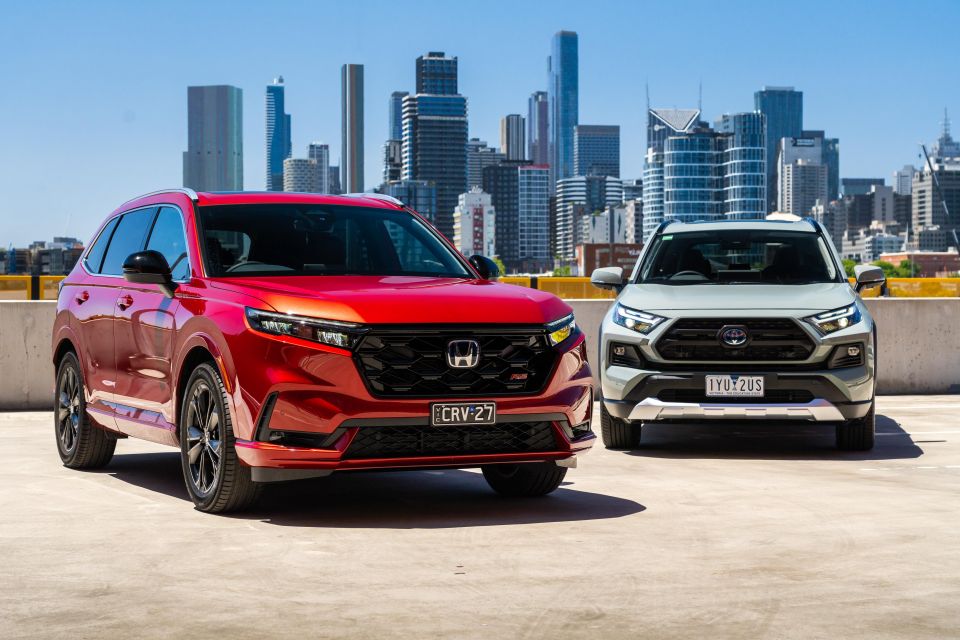
- Toyota RAV4 – 2192
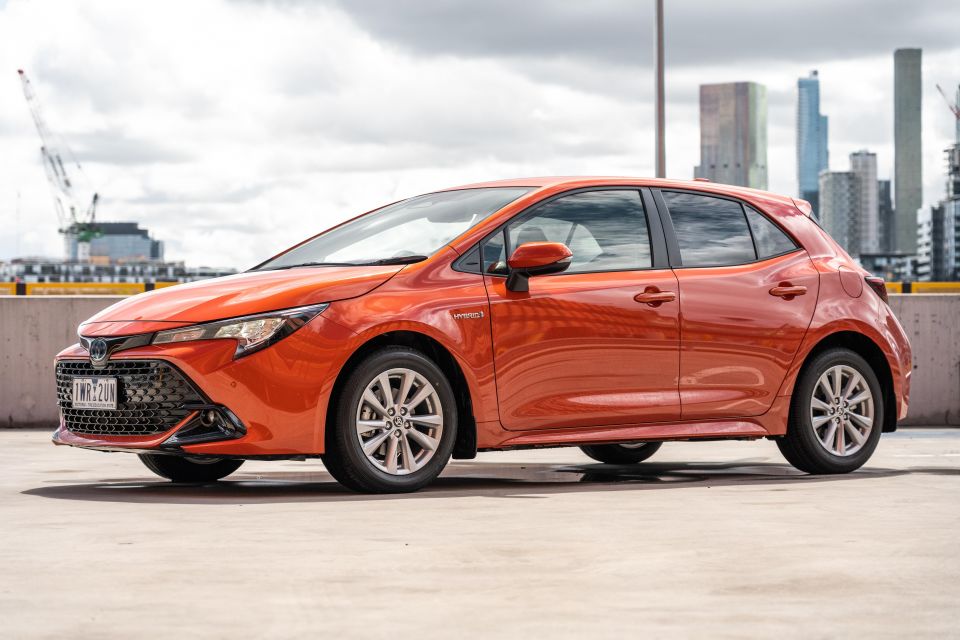
- Toyota Corolla – 1888
- Mitsubishi Outlander – 1882
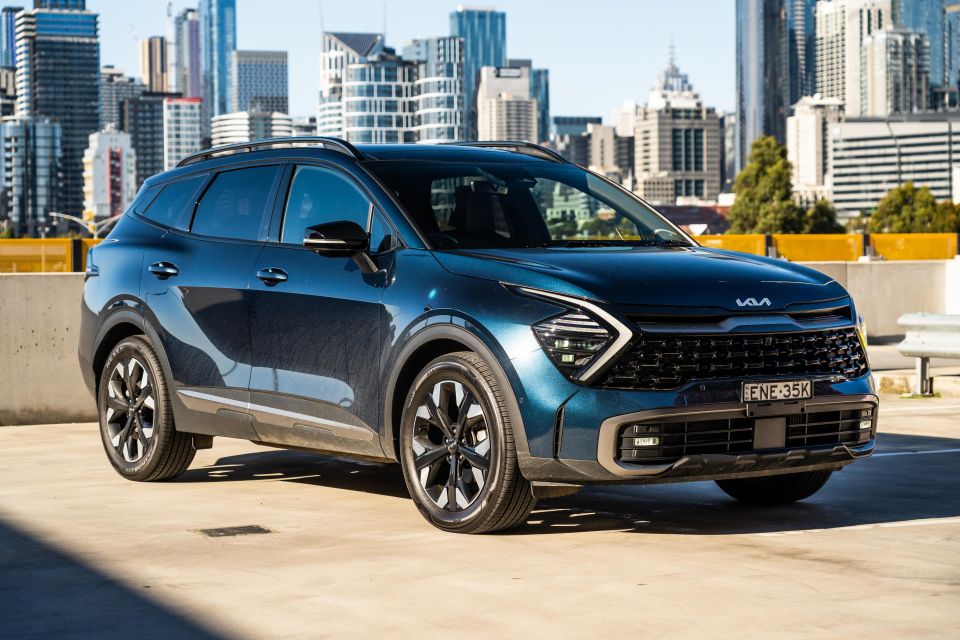
- Kia Sportage – 1546
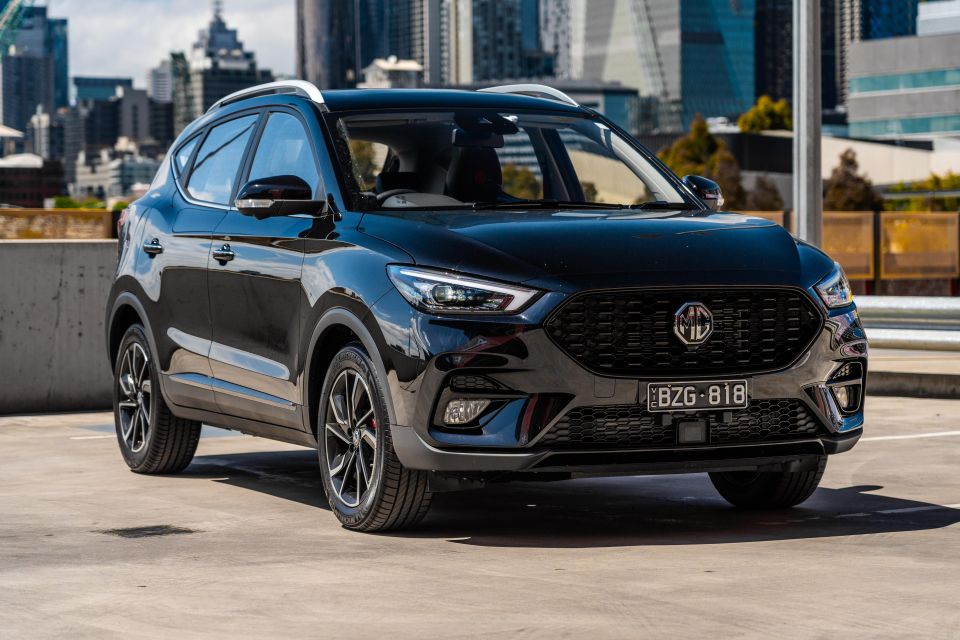
- MG ZS – 1522
- Ford Everest – 1496
- Subaru Forester – 1447
- Mazda CX-5 – 1423
- Hyundai Tucson – 1390
- Mitsubishi Triton – 1354
- Tesla Model Y – 1351
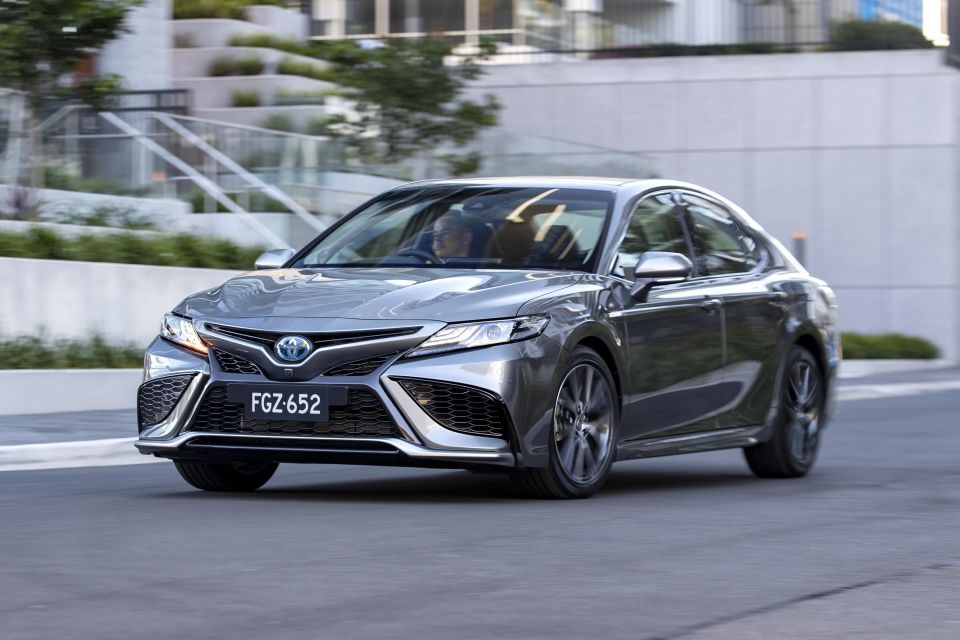
- Toyota Camry – 1312
- Toyota LandCruiser Wagon – 1311
- Mazda BT-50 – 1288
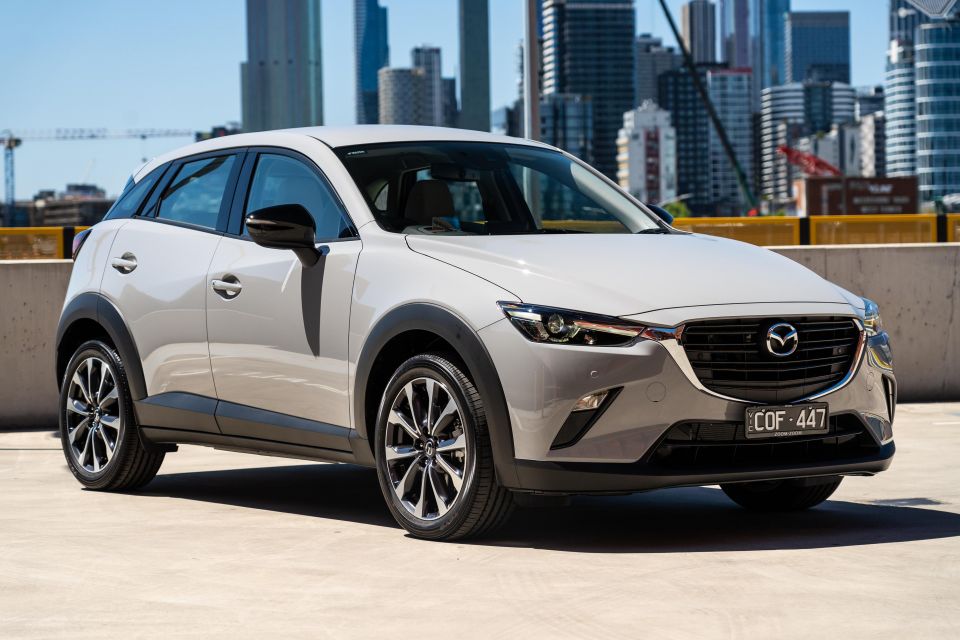
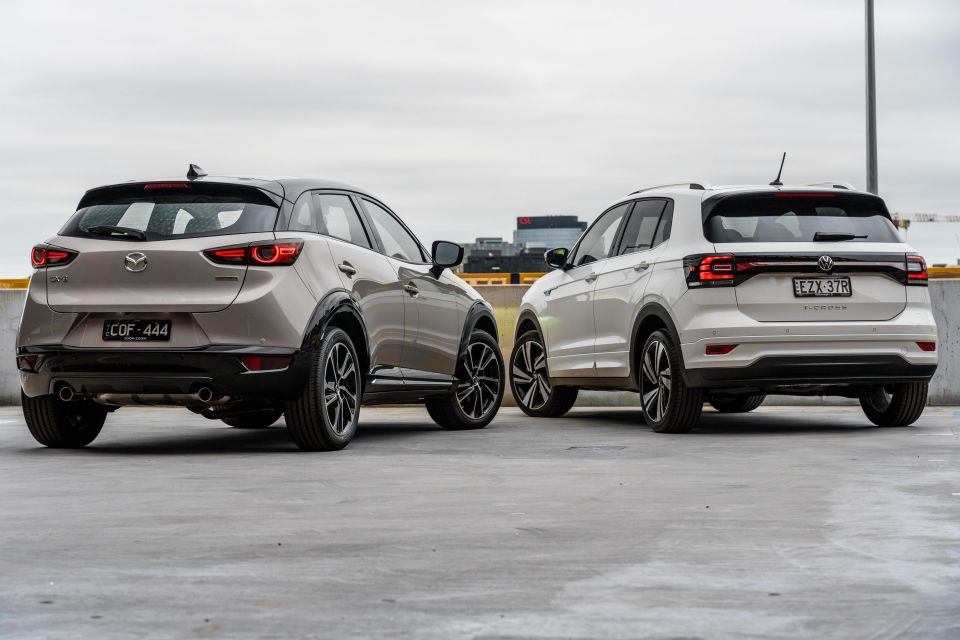
- Mazda CX-3 – 1252
- Isuzu MU-X – 1154
- Toyota LandCruiser ute – 1083
- GWM Haval Jolion – 1083
- Hyundai i30 – 1047
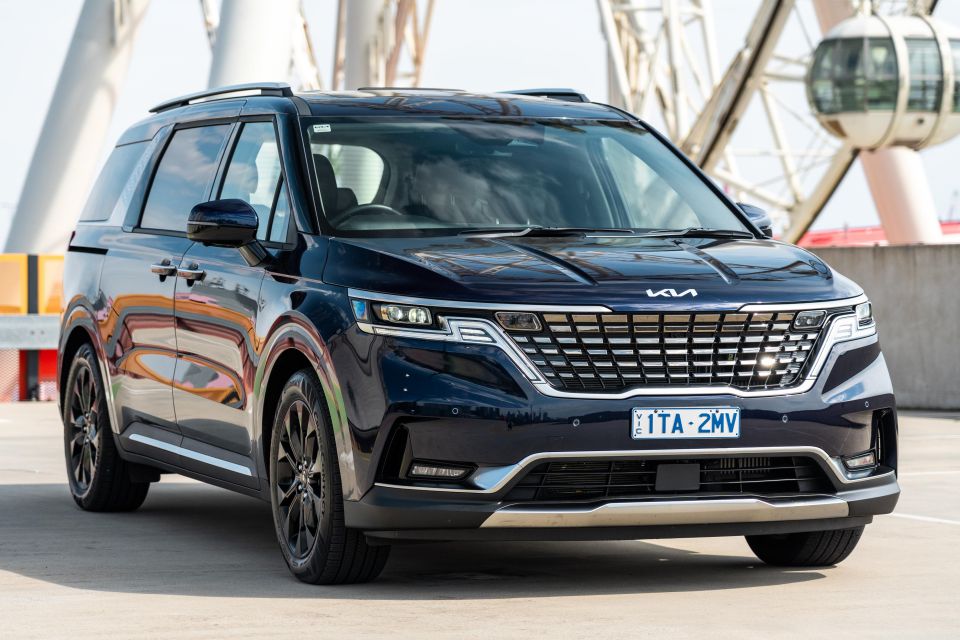
- Kia Carnival – 1001
- Hyundai Kona – 995
Segments
- Micro cars: Kia Picanto (408), Fiat 500 (42)
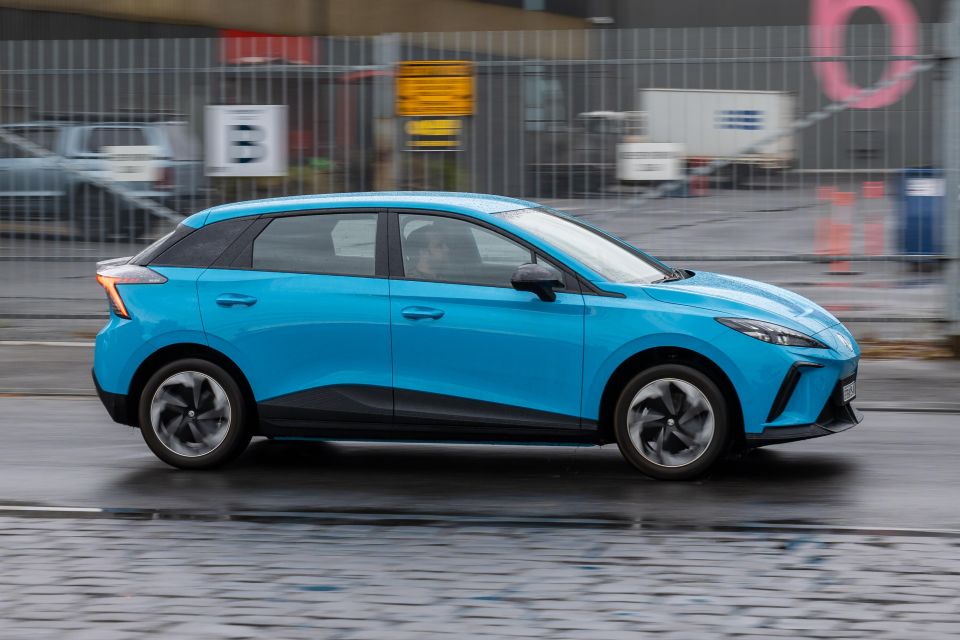
- Light cars under $30,000: MG 3 (728), Suzuki Swift (428), Mazda 2 (326)
- Light cars over $30,000: Mini Hatch (154), Audi A1 (28), Skoda Fabia (24)
- Small cars under $40,000: Toyota Corolla (1888), Hyundai i30 (1047), Kia Cerato (645)
- Small cars over $40,000: MG 4 (607), Audi A3 (371), Subaru WRX (246)
- Medium cars under $60,000: Toyota Camry (1312), BYD Seal (471), Mazda 6 (86)
- Medium cars over $60,000: Tesla Model 3 (841), Polestar 2 (405), BMW 3 Series (189)
- Large cars under $70,000: Skoda Superb (23), Kia Stinger (12), Citroen C5 X (1)
- Large cars over $70,000: BMW 5 Series (52), Mercedes-Benz EQE (49), Mercedes-Benz E-Class (40)
- Upper large cars over $100,000: Mercedes-Benz EQS (21), Mercedes-Benz S-Class (7), BMW 8 Series Gran Coupe (5)
- People movers under $70,000: Kia Carnival (1001), Hyundai Staria (118), Volkswagen Multivan (59)
- People movers over $70,000: Lexus LM (41), Mercedes-Benz V-Class (15), Volkswagen California (9)
- Sports cars under $80,000: BMW 2 Series (98), Toyota GR86 (91), Subaru BRZ (79)
- Sports cars over $80,000: BMW 4 Series (59), Mercedes-Benz C-Class coupe/convertible (33), Toyota Supra (29)
- Sports cars over $200,000: Porsche 911 (23), Bentley Continental GT/GTC (17), Mercedes-AMG SL (17)
- Light SUVs: Mazda CX-3 (1252), Toyota Yaris Cross (675), Kia Stonic (399)
- Small SUVsunder $45,000: MG ZS (1522), GWM Haval Jolion (1083), Hyundai Kona (995)
- Small SUVs over $45,000: Volvo XC40 (526), BMW X1 (375), Lexus UX (223)
- Medium SUVs under $60,000: Toyota RAV4 (2192), Mitsubishi Outlander (1882), Kia Sportage (1546)
- Medium SUVs over $60,000: Tesla Model Y (1351), Lexus NX (506), Mercedes-Benz GLC wagon (395)
- Large SUVs under $70,000: Toyota Prado (2475), Ford Everest (1496), Isuzu MU-X (1154)
- Large SUVs over $70,000: BMW X5 (425), Land Rover Defender (256), Kia EV6 (252)
- Upper Large SUVs under $120,000: Toyota LandCruiser Wagon (1311), Nissan Patrol (556), Kia EV9 (91)
- Upper Large SUVs over $120,000: BMW X7 (98), Lexus LX (58), Mercedes-Benz GLS (55)
- Light vans: Peugeot Partner (64), Volkswagen Caddy (58)
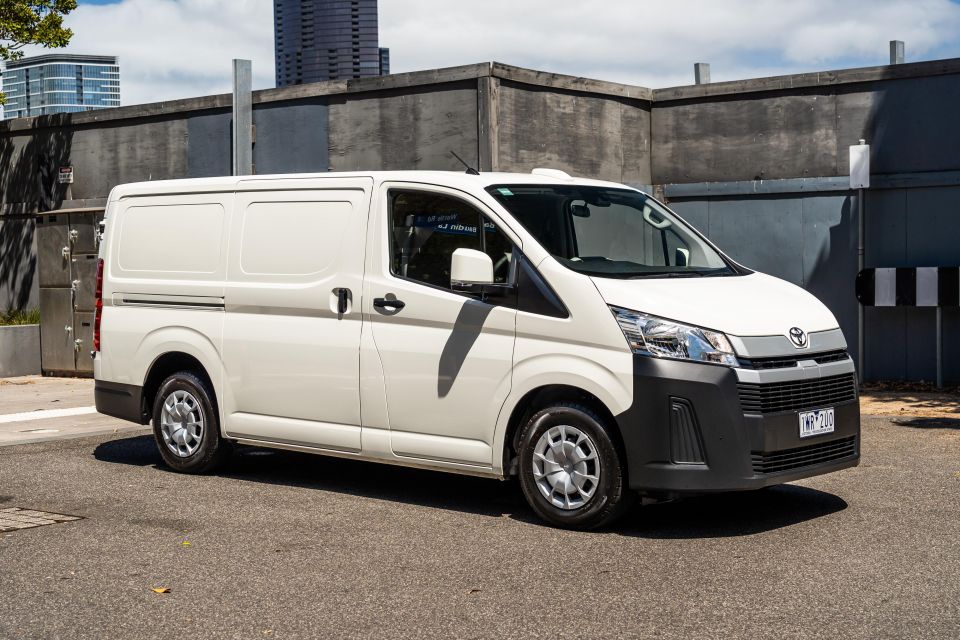
- Medium vans: Toyota HiAce (654), LDV G10 (210), Ford Transit Custom (205)
- 4×2 utes: Toyota HiLux (696), Isuzu D-Max (449), Ford Ranger (408)
- 4×4 utes: Ford Ranger (7359), Toyota HiLux (4447), Isuzu D-Max (2384)
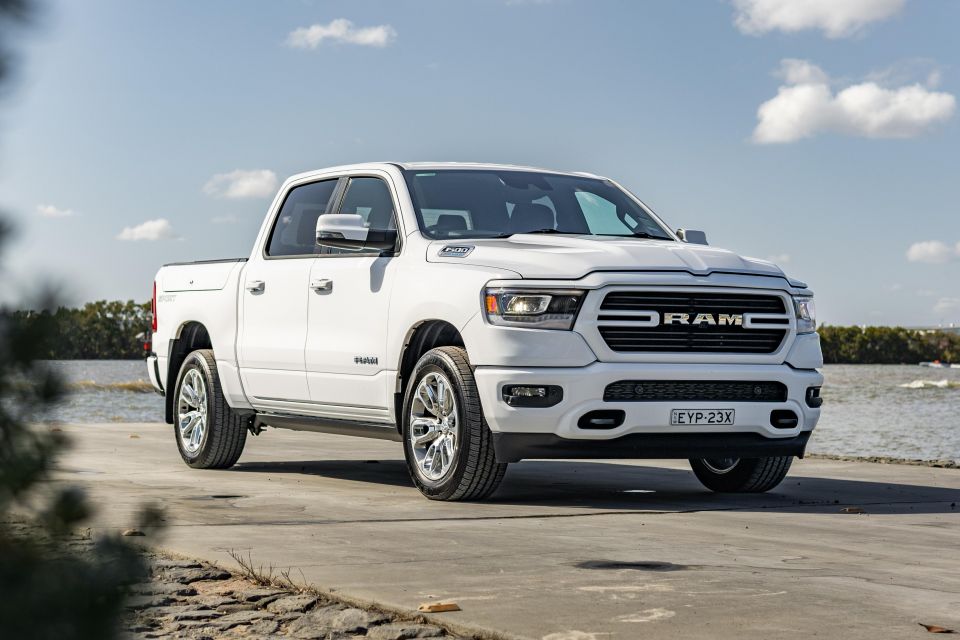
- 4×4 utes over $100,000: Ram 1500 (283), Chevrolet Silverado (264), Ford F-150 (113)
Sales by region
- New South Wales: 28,675 sales, up 11.2 per cent
- Victoria: 27,508 sales, up 14.6 per cent
- Queensland: 21,188 sales, up 4.9 per cent
- WesternAustralia: 9850 sales, up 14.1 per cent
- SouthAustralia: 7135 sales, up 26.3 per cent
- Tasmania: 2105 sales, up 26.2 per cent
- AustralianCapitalTerritory: 1340 sales, up 6.9 per cent
- NorthernTerritory: 743 sales, up 5.1 per cent
Sales by vehicle type
- SUVs: 52,275 sales, 53 per cent market share
- Lightcommercialvehicles: 25,639 sales, 26 per cent market share
- Passengervehicles: 16,245 sales, 16.5 per cent market share
- Heavycommercialvehicles: 4385 sales, 4.4 per cent market share
Top segments by market share
- 4×4 ute: 20,817 sales, 21.1 per cent market share
- Medium SUV: 19,903 sales, 20.2 per cent market share
- Large SUV: 13,559 sales, 13.8 per cent market share
- Small SUV: 12,784 sales, 13 per cent market share
- Small cars: 7316 sales, 7.4 per cent market share
Sales by buyer type
- Private: 46,203 sales, down 1.7 per cent
- Business: 38,154 sales, up 30 per cent
- Government: 3384 sales, up 65.3 per cent
- Rental: 6418 sales, up 24.5 per cent
Sales by propulsion or fuel type
- Petrol: 40,993 sales, 41.6 per cent market share
- Diesel: 35,214 sales, 35.7 per cent market share
- Hybrid: 9875 sales, 10 per cent market share
- Electric: 6771 sales, 6.9 per cent market share
- Plug–inhybrid: 1302 sales, 1.32 per cent market share
Sales by country of origin
- Japan: 27,812 sales, up 4.6 per cent
- Thailand: 24,621 sales, up 28.8 per cent
- China: 15,001 sales, up 2 per cent
- Korea: 11,185 sales, up 4.1 per cent
- Germany: 4452 sales, up 59.1 per cent
MORE: VFACTS 2023: All-time Australian sales record, Ford Ranger tops charts
MORE: VFACTS 2023: Chinese car sales soar, push past Korean cars
MORE: VFACTS: The biggest sales winners of 2023
MORE: VFACTS: The biggest sales losers of 2023
